
PUBLISHER: Global Market Insights Inc. | PRODUCT CODE: 1928948

PUBLISHER: Global Market Insights Inc. | PRODUCT CODE: 1928948
Electric Two-wheeler Market Opportunity, Growth Drivers, Industry Trend Analysis, and Forecast 2026 - 2035
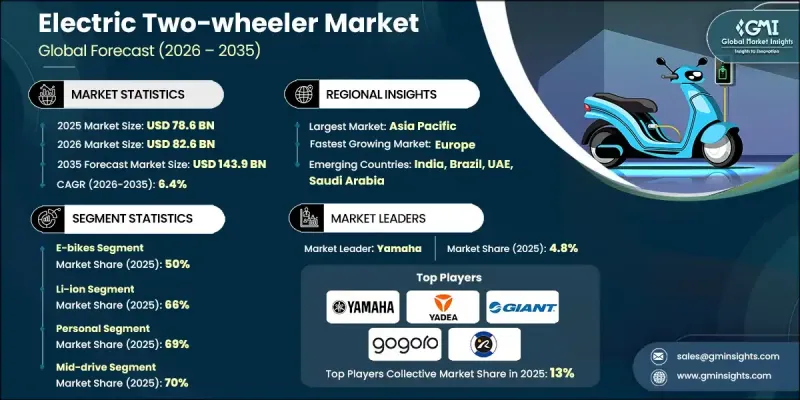
The Global Electric Two-wheeler Market was valued at USD 78.6 billion in 2025 and is estimated to grow at a CAGR of 6.4% to reach USD 143.9 billion by 2035.
Growing awareness of air quality deterioration and climate-related challenges is encouraging consumers to shift toward cleaner mobility solutions. Electric two-wheelers, which operate without tailpipe emissions, are increasingly viewed as a practical way to lower individual carbon output, supporting sustainability goals across both developed and emerging economies. Public policy continues to play a critical role in accelerating adoption, as governments introduce financial incentives that reduce upfront costs and improve affordability. Continuous innovation in battery systems has enhanced vehicle efficiency through higher energy density, shorter charging durations, and improved durability. Additional technological upgrades, including intelligent connectivity features and advanced braking systems, are enhancing overall usability. These combined factors are improving consumer confidence and expanding the addressable customer base, positioning electric two-wheelers as a viable alternative to conventional fuel-powered options.
| Market Scope | |
|---|---|
| Start Year | 2025 |
| Forecast Year | 2026-2035 |
| Start Value | $78.6 Billion |
| Forecast Value | $143.9 Billion |
| CAGR | 6.4% |
The e-bike segment held a 50% share in 2025 and is projected to grow at a CAGR of 6.5% through 2035. This growth is fueled by increasing consumer preference for assisted mobility, eco-friendly commuting, and lifestyle-oriented transportation solutions. E-bikes appeal to urban commuters seeking convenience, cost-effective alternatives to cars, and environmentally responsible travel options. Additionally, the rising interest in fitness-oriented cycling and recreational outdoor activities is further boosting adoption.
The lithium-ion batteries segment accounted for 66% share in 2025 and is expected to grow at a CAGR of 6% between 2026 and 2035. The segment's growth is driven by high energy density, extended operating range, faster charging capabilities, and decreasing production costs. Improvements in battery management systems, thermal regulation, and cell durability are enhancing safety and performance, making Li-ion technology the preferred choice for most electric two-wheeler manufacturers.
China Electric Two-wheeler Market held a 40% share, generating USD 24.2 billion in 2025. Strong government incentives, such as subsidies, tax exemptions, and purchase rebates, combined with large-scale adoption initiatives, have significantly lowered ownership costs and boosted consumer uptake. Urban policies promoting clean mobility, coupled with the rapid expansion of charging infrastructure, have further accelerated the growth of electric two-wheelers in the country, positioning China as the leading market in the region.
Key participants active in the Global Electric Two-wheeler Market include Yadea, Yamaha Motor Company, Niu Technologies, Ola, Gogoro, Ather, VMOTO SOCO, Giant, Hero Electric, and Jiangsu Xinri E-Vehicle. Companies operating in the Global Electric Two-wheeler Market are focusing on strengthening their market position through aggressive product innovation and battery technology advancements. Many players are investing in localized manufacturing and supply chains to reduce costs and improve delivery timelines. Strategic partnerships with battery suppliers and charging infrastructure providers help improve ecosystem reliability. Firms are also expanding model portfolios to address different price points and usage needs. Digital sales platforms, financing options, and after-sales service networks are being enhanced to improve customer experience.
Table of Contents
Chapter 1 Methodology & Scope
- 1.1 Research approach
- 1.2 Quality Commitments
- 1.2.1 GMI AI policy & data integrity commitment
- 1.2.1.1 Source consistency protocol
- 1.2.1 GMI AI policy & data integrity commitment
- 1.3 Research Trail & Confidence Scoring
- 1.3.1 Research Trail Components
- 1.3.2 Scoring Components
- 1.4 Data Collection
- 1.4.1 Partial list of primary sources
- 1.5 Data mining sources
- 1.5.1 Paid sources
- 1.5.1.1 Sources, by region
- 1.5.1 Paid sources
- 1.6 Base estimates and calculations
- 1.6.1 Base year calculation for any one approach
- 1.7 Forecast model
- 1.7.1 Quantified market impact analysis
- 1.7.1.1 Mathematical impact of growth parameters on forecast
- 1.7.1 Quantified market impact analysis
- 1.8 Research transparency addendum
- 1.8.1 Source attribution framework
- 1.8.2 Quality assurance metrics
- 1.8.3 Our commitment to trust
Chapter 2 Executive Summary
- 2.1 Industry 360° synopsis, 2022 - 2035
- 2.2 Key market trends
- 2.2.1 Regional
- 2.2.2 Vehicle
- 2.2.3 Battery
- 2.2.4 Motor
- 2.2.5 Motor power
- 2.2.6 Voltage
- 2.2.7 End use
- 2.3 TAM Analysis, 2026-2035
- 2.4 CXO perspectives: Strategic imperatives
- 2.4.1 Executive decision points
- 2.4.2 Critical success factors
- 2.5 Future outlook and strategic recommendations
Chapter 3 Industry Insights
- 3.1 Industry ecosystem analysis
- 3.1.1 Supplier landscape
- 3.1.2 Profit margin analysis
- 3.1.3 Cost structure
- 3.1.4 Value addition at each stage
- 3.1.5 Factor affecting the value chain
- 3.1.6 Disruptions
- 3.2 Industry impact forces
- 3.2.1.1 Growth drivers
- 3.2.1.2 Government support and incentives
- 3.2.1.3 Technological advancements
- 3.2.1.4 Environmental consciousness
- 3.2.1.5 Urban mobility and traffic congestion
- 3.2.2 Industry pitfalls and challenges
- 3.2.2.1 High initial costs
- 3.2.2.2 Charging infrastructure
- 3.2.3 Market opportunities
- 3.2.3.1 Rising adoption in Asia Pacific
- 3.2.3.2 Electric scooter and bike sharing
- 3.2.3.3 OEM partnerships and innovations
- 3.2.3.4 Expansion in emerging markets
- 3.3 Growth potential analysis
- 3.4 Regulatory landscape
- 3.4.1 North America
- 3.4.1.1 U.S. National Highway Traffic Safety Administration (NHTSA) Regulations
- 3.4.1.2 Environmental Protection Agency (EPA) Emission Standards
- 3.4.1.3 California Air Resources Board (CARB) Standards
- 3.4.2 Europe
- 3.4.2.1 European Union General Safety Regulation (EU GSR)
- 3.4.2.2 EU Directive on End-of-Life Vehicles (ELV)
- 3.4.2.3 European Commission Safety Standards for Passenger Vehicles
- 3.4.2.4 European Union Type Approval Process
- 3.4.3 Asia Pacific
- 3.4.3.1 China National Standards for Vehicle Safety
- 3.4.3.2 India Bureau of Indian Standards (BIS) Airbag Regulations
- 3.4.3.3 Japan Ministry of Land, Infrastructure, Transport and Tourism (MLIT) Regulations
- 3.4.3.4 ASEAN Road Safety Standards
- 3.4.4 Latin America
- 3.4.4.1 Brazil National Traffic Department (DENATRAN) Standards
- 3.4.4.2 Argentina National Road Safety Agency (ANSV) Regulations
- 3.4.4.3 Mexico Secretariat of Communications and Transport (SCT) Regulations
- 3.4.4.4 MERCOSUR Harmonization of Vehicle Safety Standards
- 3.4.5 Middle East & Africa
- 3.4.5.1 UAE Federal Vehicle Safety Law
- 3.4.5.2 Saudi Arabian Standards Organization (SASO) Vehicle Safety Regulations
- 3.4.5.3 South African Bureau of Standards (SABS) AUTOMOTIVE REGULATIONS
- 3.4.1 North America
- 3.5 Porter';s analysis
- 3.6 PESTEL analysis
- 3.7 Technology and innovation landscape
- 3.7.1 Current technological trends
- 3.7.2 Emerging technologies
- 3.8 Price trends
- 3.8.1 By region
- 3.8.2 By product
- 3.9 Production statistics
- 3.9.1 Production hubs
- 3.9.2 Consumption hubs
- 3.9.3 Export and import
- 3.10 Cost breakdown analysis
- 3.11 Patent analysis
- 3.12 Sustainability and environmental aspects
- 3.12.1 Sustainable practices
- 3.12.2 Waste reduction strategies
- 3.12.3 Energy efficiency in production
- 3.12.4 Eco-friendly Initiatives
- 3.12.5 Carbon footprint considerations
Chapter 4 Competitive Landscape, 2025
- 4.1 Introduction
- 4.2 Company market share analysis
- 4.2.1 North America
- 4.2.2 Europe
- 4.2.3 Asia Pacific
- 4.2.4 LATAM
- 4.2.5 MEA
- 4.3 Competitive analysis of major market players
- 4.4 Competitive positioning matrix
- 4.5 Strategic outlook matrix
- 4.6 Key developments
- 4.6.1 Mergers & acquisitions
- 4.6.2 Partnerships & collaborations
- 4.6.3 New Product Launches
- 4.6.4 Expansion Plans and funding
Chapter 5 Market Estimates & Forecast, By Vehicle, 2022 - 2035 ($Mn, Units)
- 5.1 Key trends
- 5.2 Electric motorcycle
- 5.3 Electric Scooter
- 5.4 E-bikes
- 5.5 Electric kick scooter
Chapter 6 Market Estimates & Forecast, By Battery, 2022 - 2035 ($Mn, Units)
- 6.1 Key trends
- 6.2 SLA
- 6.3 Li-ion
- 6.4 Others
Chapter 7 Market Estimates & Forecast, By Motor, 2022 - 2035 ($Mn, Units)
- 7.1 Key trends
- 7.2 Mid-drive
- 7.3 Hub
- 7.4 Others
Chapter 8 Market Estimates & Forecast, By Motor Power, 2022 - 2035 ($Mn, Units)
- 8.1 Key trends
- 8.2 Below 3.5 kW
- 8.3 3.5 kW - 6.5 kW
- 8.4 Above 6.5 kW
Chapter 9 Market Estimates & Forecast, By Voltage, 2022 - 2035 ($Mn, Units)
- 9.1 Key trends
- 9.2 48V
- 9.3 60 V
- 9.4 72V
- 9.5 Others
Chapter 10 Market Estimates & Forecast, By End Use, 2022 - 2035 ($Mn, Units)
- 10.1 Personal
- 10.2 Commercial
- 10.3 Shared Mobility
Chapter 11 Market Estimates & Forecast, By Region, 2022 - 2035 ($Mn, Units)
- 11.1 Key trends
- 11.2 North America
- 11.2.1 US
- 11.2.2 Canada
- 11.3 Europe
- 11.3.1 UK
- 11.3.2 Germany
- 11.3.3 France
- 11.3.4 Italy
- 11.3.5 Spain
- 11.3.6 Russia
- 11.3.7 Denmark
- 11.4 Asia Pacific
- 11.4.1 China
- 11.4.2 India
- 11.4.3 Japan
- 11.4.4 South Korea
- 11.4.5 ANZ
- 11.4.6 Singapore
- 11.5 Latin America
- 11.5.1 Brazil
- 11.5.2 Argentina
- 11.5.3 Mexico
- 11.6 MEA
- 11.6.1 UAE
- 11.6.2 Saudi Arabia
- 11.6.3 South Africa
Chapter 12 Company Profiles
- 12.1 Global Players
- 12.1.1 Autoliv
- 12.1.2 Bosch
- 12.1.3 Continental
- 12.1.4 Daicel
- 12.1.5 Delphi
- 12.1.6 Denso
- 12.1.7 Hyundai Mobis
- 12.1.8 Joyson Safety Systems
- 12.1.9 ZF
- 12.1.10 Ather
- 12.1.11 Giant
- 12.1.12 Gogoro
- 12.1.13 Hero Electric
- 12.1.14 Jiangsu Xinri E-Vehicle
- 12.1.15 Niu Technologies
- 12.1.16 Ola
- 12.1.17 VMOTO SOCO
- 12.1.18 Yadea
- 12.1.19 Yamaha Motor Company
- 12.2 Regional Players
- 12.2.1 ARC Automotive
- 12.2.2 Ashimori Industry
- 12.2.3 ITW Automotive
- 12.2.4 Kolon Industries
- 12.2.5 Nippon Kayaku
- 12.2.6 Seiren
- 12.2.7 Toyoda Gosei
- 12.3 Emerging Players
- 12.3.1 Jinheng Automotive Safety Technology
- 12.3.2 Nihon Plast
- 12.3.3 Swicofil
- 12.3.4 Tenaris

