
PUBLISHER: Global Market Insights Inc. | PRODUCT CODE: 1750307

PUBLISHER: Global Market Insights Inc. | PRODUCT CODE: 1750307
Carpool-as-a-Service Market Opportunity, Growth Drivers, Industry Trend Analysis, and Forecast 2025 - 2034
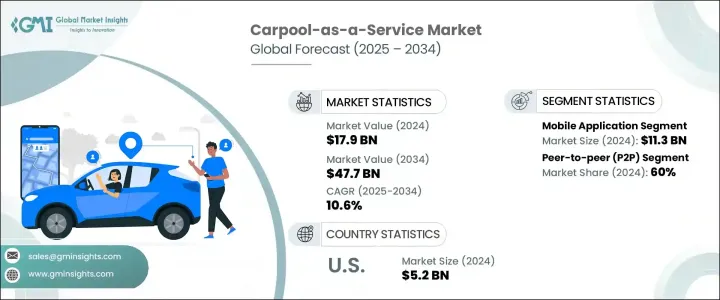
The Global Carpool-As-A-Service (CaaS) Market was valued at USD 17.9 billion in 2024 and is estimated to grow at a CAGR of 10.6% to reach USD 47.7 billion by 2034. The market is experiencing robust momentum, propelled by increasing urban congestion, heightened awareness of environmental sustainability, and a growing preference for affordable, shared transportation solutions. As cities become more digitally connected and sustainability becomes a primary objective, carpooling is being integrated into multimodal transport systems by private operators, municipal transit agencies, and corporate mobility programs. This integration is addressing key challenges such as traffic congestion, fuel consumption, and commuting costs while meeting the evolving needs of today's mobility users.
Demand for CaaS is expanding across various use cases, including routine commuting, employee shuttles, long-haul rides, and transportation for events. The convenience of app-based bookings, instant ride-matching, and optimized routing has positioned carpooling as a viable and attractive alternative to single-occupancy vehicle use. Businesses are adopting these platforms to improve employee transportation, reduce fleet management burdens, and align with environmental, social, and governance (ESG) commitments. The widespread appeal of shared rides among workers, students, and city dwellers continues to support daily adoption in both urban centers and expanding suburban regions.
| Market Scope | |
|---|---|
| Start Year | 2024 |
| Forecast Year | 2025-2034 |
| Start Value | $17.9 Billion |
| Forecast Value | $47.7 Billion |
| CAGR | 10.6% |
Advanced technology is a key enabler in the development of CaaS. Innovations in artificial intelligence, GPS tracking, real-time route mapping, in-app payments, and algorithm-based ride matching are driving service efficiency and customer satisfaction. These solutions are being integrated into broader mobility-as-a-service (MaaS) platforms, linking carpooling to digital wallets, real-time public transit data, and smart city infrastructure. This level of interoperability is critical for building a fully connected urban transport ecosystem.
In terms of platforms, the market is segmented into mobile applications, hybrid systems, and web-based solutions. Mobile applications led the market, with revenue reaching approximately USD 11.3 billion in 2024. The dominance of this segment is fueled by increasing smartphone usage, widespread mobile internet access, and growing demand for real-time ride-sharing solutions. These applications offer a user-friendly interface and convenient access to features like ride scheduling, live tracking, and digital payments. Service providers are focusing on mobile-centric strategies that improve user engagement through personalized notifications, location-specific services, and smooth navigation, all of which enhance loyalty and user retention. Mobile apps also integrate with connected vehicle systems and voice assistants, allowing for hands-free interaction, real-time traffic insights, and tailored commuting suggestions. Additionally, the mobile-first model enables rapid expansion with minimal infrastructure requirements, allowing providers to launch and scale efficiently.
The market is also segmented by type into peer-to-peer (P2P), business-to-consumer (B2C), and other models. The P2P segment accounted for the largest share at 60% in 2024. The growth of this segment is underpinned by rising interest in decentralized ride-sharing networks that connect private vehicle owners with passengers directly through digital platforms. This arrangement reduces overhead, offers flexibility, and allows individuals to monetize their vehicle's idle capacity. It appeals to daily commuters seeking cost savings and drivers looking for extra income. P2P platforms come equipped with features such as intelligent ride matching, secure payments, and direct in-app communication, which strengthen user confidence and simplify ride coordination. As urban centers grow and commuting demand increases, P2P services continue to gain popularity, especially among students, freelancers, and urban professionals.
From a business model standpoint, the CaaS market includes commission-based, subscription-based, freemium, and other revenue strategies. The commission-based model dominated the market in 2024 due to its scalable structure that allows platforms to earn a percentage of each completed ride. This model supports growth with minimal upfront investment, making it attractive for both users and providers. It encourages broad participation from casual users and part-time drivers without the need for expensive onboarding or fleet investments. The structure is widely used due to its simplicity, low operational costs, and adaptability across different markets, especially for platforms that operate with asset-light frameworks.
By application, the market is divided into daily commuting, long-distance travel, airport transfers, event-based travel, and others. Daily commuting emerged as the leading segment in 2024, accounting for the highest revenue share. This segment is expanding as urban congestion worsens, fuel prices rise, and consumers become more conscious of eco-friendly commuting alternatives. Carpooling helps reduce traffic pressure, cut emissions, and lower commuting expenses. Users such as professionals, students, and gig workers regularly rely on these services, especially in cities with high vehicle density and limited parking. Features like GPS-assisted route planning and mobile payments improve reliability, particularly during peak hours. Businesses and institutions are increasingly promoting daily carpooling by offering incentives and integrating shared rides into internal mobility systems.
Regionally, the United States led the North American market, generating USD 5.2 billion in 2024 and projected to grow at a CAGR of 10.9% during the forecast period. Growth in the U.S. is driven by high smartphone adoption, established digital infrastructure, and a large commuting population. Major cities across the country face daily traffic challenges, creating strong demand for alternative transit solutions. The presence of multiple service providers offering advanced digital solutions also supports widespread adoption. Government policies encouraging sustainable transportation, combined with access to carpool lanes and reduced tolls for shared vehicles, further incentivize CaaS usage. The market is evolving rapidly as companies continue to invest in cloud-based systems, predictive analytics, and AI-driven tools that enhance rider experience, operational efficiency, and environmental performance.
Table of Contents
Chapter 1 Methodology & Scope
- 1.1 Research design
- 1.1.1 Research approach
- 1.1.2 Data collection methods
- 1.2 Base estimates & calculations
- 1.2.1 Base year calculation
- 1.2.2 Key trends for market estimation
- 1.3 Forecast model
- 1.4 Primary research and validation
- 1.4.1 Primary sources
- 1.4.2 Data mining sources
- 1.5 Market scope & definition
Chapter 2 Executive Summary
- 2.1 Industry 3600 synopsis, 2021 - 2034
Chapter 3 Industry Insights
- 3.1 Industry ecosystem analysis
- 3.1.1 Supplier landscape
- 3.1.1.1 Raw material providers
- 3.1.1.2 Component providers
- 3.1.1.3 Manufacturers
- 3.1.1.4 Technology providers
- 3.1.1.5 Distribution channel analysis
- 3.1.1.6 End use
- 3.1.2 Profit margin analysis
- 3.1.1 Supplier landscape
- 3.2 Impact of Trump administration tariffs
- 3.2.1 Impact on trade
- 3.2.1.1 Trade volume disruptions
- 3.2.1.2 Retaliatory measures
- 3.2.2 Impact on industry
- 3.2.2.1 Supply-side impact (raw materials)
- 3.2.2.1.1 Price volatility in key materials
- 3.2.2.1.2 Supply chain restructuring
- 3.2.2.1.3 Production cost implications
- 3.2.2.2 Demand-side impact (selling price)
- 3.2.2.2.1 Price transmission to end markets
- 3.2.2.2.2 Market share dynamics
- 3.2.2.2.3 Consumer response patterns
- 3.2.2.1 Supply-side impact (raw materials)
- 3.2.3 Strategic industry responses
- 3.2.3.1 Supply chain reconfiguration
- 3.2.3.2 Pricing and product strategies
- 3.2.1 Impact on trade
- 3.3 Technology & innovation landscape
- 3.4 Patent analysis
- 3.5 Regulatory landscape
- 3.6 Cost breakdown analysis
- 3.7 Key news & initiatives
- 3.8 Impact forces
- 3.8.1 Growth drivers
- 3.8.1.1 Urban congestion and pollution reduction
- 3.8.1.2 Government support and policy push
- 3.8.1.3 Cost savings for users
- 3.8.1.4 Technology and platform maturity
- 3.8.2 Industry pitfalls & challenges
- 3.8.2.1 Low occupancy and reliability issues
- 3.8.2.2 User trust and safety concerns
- 3.8.1 Growth drivers
- 3.9 Growth potential analysis
- 3.10 Porter's analysis
- 3.11 PESTEL analysis
Chapter 4 Competitive Landscape, 2024
- 4.1 Introduction
- 4.2 Company market share analysis
- 4.3 Competitive positioning matrix
- 4.4 Strategic outlook matrix
Chapter 5 Market Estimates & Forecast, By Business Model, 2021 - 2034 ($Bn)
- 5.1 Key trends
- 5.2 Commission-Based model
- 5.3 Subscription-Based model
- 5.4 Freemium model
- 5.5 Others
Chapter 6 Market Estimates & Forecast, By Platform, 2021 - 2034 ($Bn)
- 6.1 Key trends
- 6.2 Mobile application
- 6.3 Hybrid
- 6.4 Web-based platform
Chapter 7 Market Estimates & Forecast, By Type, 2021 - 2034 ($Bn)
- 7.1 Key trends
- 7.2 Peer-to-Peer (P2P)
- 7.3 Business-to-Consumer (B2C)
- 7.4 Others
Chapter 8 Market Estimates & Forecast, By Application, 2021 - 2034 ($Bn)
- 8.1 Key trends
- 8.2 Daily commuting
- 8.3 Long-Distance travel
- 8.4 Airport transfers
- 8.5 Event-Based travel
- 8.6 Others
Chapter 9 Market Estimates & Forecast, By Region, 2021 - 2034 ($Bn, Units)
- 9.1 Key trends
- 9.2 North America
- 9.2.1 U.S.
- 9.2.2 Canada
- 9.3 Europe
- 9.3.1 Germany
- 9.3.2 France
- 9.3.3 UK
- 9.3.4 Spain
- 9.3.5 Italy
- 9.3.6 Russia
- 9.3.7 Nordics
- 9.4 Asia Pacific
- 9.4.1 China
- 9.4.2 India
- 9.4.3 Japan
- 9.4.4 South Korea
- 9.4.5 ANZ
- 9.4.6 Southeast Asia
- 9.5 Latin America
- 9.5.1 Brazil
- 9.5.2 Mexico
- 9.5.3 Argentina
- 9.6 MEA
- 9.6.1 UAE
- 9.6.2 South Africa
- 9.6.3 Saudi Arabia
Chapter 10 Company Profiles
- 10.1 Berymo
- 10.2 BlaBlaCar
- 10.3 Carma
- 10.4 DiDi
- 10.5 Getaround
- 10.6 Gojek Tech
- 10.7 Grab.
- 10.8 Liftshare
- 10.9 Lyft
- 10.10 Motar
- 10.11 Ola Cabs
- 10.12 Poparide
- 10.13 Quick Ride
- 10.14 Scoop
- 10.15 Splt
- 10.16 Trempy
- 10.17 Uber
- 10.18 Via.
- 10.19 Waze Carpool
- 10.20 Zimride

