
PUBLISHER: Global Market Insights Inc. | PRODUCT CODE: 1750498

PUBLISHER: Global Market Insights Inc. | PRODUCT CODE: 1750498
Non-Perishable Milk Market Opportunity, Growth Drivers, Industry Trend Analysis, and Forecast 2025 - 2034
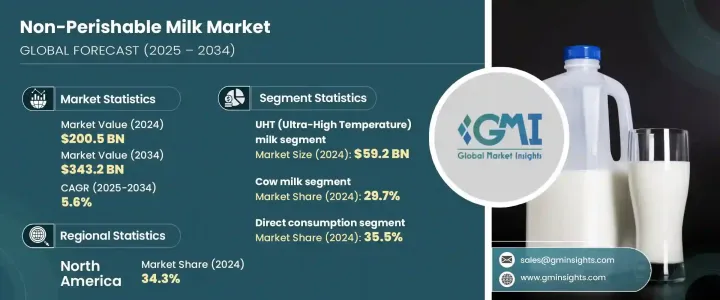
The Global Non-Perishable Milk Market was valued at USD 200.5 billion in 2024 and is estimated to grow at a CAGR of 5.6% to reach USD 343.2 billion by 2034. This growth is largely fueled by the increasing demand for milk products with extended shelf life and minimal refrigeration requirements. Non-perishable milk has evolved from being a practical option in regions lacking cold storage to a mainstream choice worldwide. Consumers are gravitating toward options that offer convenience, nutritional value, and longer usability. With rising urbanization and shifting dietary preferences, the industry continues to expand its reach across diverse consumer groups.
The market has been shaped by growing interest in fortified, organic, and lactose-free milk variants. These preferences are reshaping product development strategies as manufacturers respond to changing health and lifestyle trends. Technological innovations, especially in processing methods, are also contributing to market expansion. Advancements in Ultra-High Temperature (UHT) treatment and high-temperature short-time (HTST) techniques, combined with aseptic packaging, have improved the safety, quality, and durability of non-perishable milk. These factors are enabling broader distribution and increased consumption, especially in areas with limited access to refrigerated goods. In parallel, there's a rise in awareness regarding calcium-rich diets, which plays into higher milk consumption patterns. Even plant-based alternatives are gaining space in the non-perishable segment, reflecting evolving consumer priorities toward sustainability and wellness.
| Market Scope | |
|---|---|
| Start Year | 2024 |
| Forecast Year | 2025-2034 |
| Start Value | $200.5 Billion |
| Forecast Value | $343.2 Billion |
| CAGR | 5.6% |
In terms of product segmentation, the non-perishable milk market includes UHT milk, evaporated milk, sweetened condensed milk, powdered milk, and others. Among these, UHT milk led the category in 2024 with a market share of 29.5%, representing USD 59.2 billion. Its dominance is attributed to its versatility and ability to remain fresh without refrigeration for extended periods, making it a preferred option in both urban and rural settings. Powdered and evaporated variants are also well-established, particularly where affordability and long-term storage are essential. Sweetened condensed milk maintains its relevance in culinary applications, though health concerns are slightly dampening its growth rate in some areas.
When evaluated by source, the market is segmented into cow milk, goat milk, buffalo milk, plant-based milk, and others. Cow milk accounted for 29.7% of the total market in 2024 and is expected to grow at a CAGR of 5.3% through 2034. Its continued popularity is supported by its availability in UHT and powdered forms, which align well with current consumer demands for convenient, ready-to-use dairy options. Goat milk is steadily gaining traction among consumers seeking lactose-intolerant-friendly or easily digestible alternatives. Meanwhile, buffalo milk retains niche appeal due to its higher fat content and regional preferences.
Distribution channels for non-perishable milk include supermarkets and hypermarkets, specialty stores, convenience stores, online retail, food service outlets, direct B2B sales, and others. Supermarkets and hypermarkets commanded the largest share of the market in 2024, accounting for 31.5%. Their popularity stems from their ability to offer a wide selection of products in one location, making them a go-to choice for everyday consumers. Specialty stores are increasingly favored for premium offerings, especially for health-centric or plant-based milk variants. Convenience stores play a key role in fulfilling demand for single-serve or on-the-go formats. Online retail is experiencing rapid growth, driven by the convenience of doorstep delivery and the expansion of e-commerce platforms. Food service channels continue to rely on UHT and powdered milk for consistent supply and ease of storage. Direct sales to businesses remain robust, particularly in institutional and commercial sectors. Additional distribution methods include vending and export-focused channels that are helping brands tap into untapped markets.
Regionally, North America held the largest share of the non-perishable milk market in 2024, contributing 34.3% of the total revenue. The regional market has seen increasing adoption of UHT milk and other long-lasting dairy products, thanks to evolving consumer lifestyles and greater interest in shelf-stable nutrition options. Europe follows closely with a strong preference for UHT milk due to its convenience and reduced reliance on cold chains.
Major industry players such as Lactalis International, Nestle S.A., Fonterra Co-operative Group Limited, Danone S.A., and Arla Foods are instrumental in driving market growth. Their influence is particularly evident in innovation, processing technology, and global distribution capabilities. These companies are consistently investing in product development and expanding their presence to meet the growing global demand for non-perishable milk products.
Table of Contents
Chapter 1 Methodology & Scope
- 1.1 Methodology and scope
- 1.2 Research methodology
- 1.3 Research scope & assumptions
- 1.4 List of data sources
- 1.5 Market estimation technique
- 1.6 Research limitations
Chapter 2 Executive Summary
- 2.1 Industry synopsis, 2021 - 2034
Chapter 3 Industry Insights
- 3.1 Industry ecosystem analysis
- 3.1.1 Factor affecting the value chain
- 3.1.2 Profit margin analysis
- 3.1.3 Manufacturers
- 3.1.4 Distributors
- 3.1.5 Impact on trade
- 3.1.6 Trade volume disruptions
- 3.2 Retaliatory measures
- 3.3 Impact on the industry
- 3.3.1 Supply-side impact (Raw Materials)
- 3.3.1.1 Price volatility in key materials
- 3.3.1.2 Supply chain restructuring
- 3.3.1.3 Production cost implications
- 3.3.1 Supply-side impact (Raw Materials)
- 3.4 Demand-side impact (Selling Price)
- 3.4.1 Price transmission to end markets
- 3.4.2 Market share dynamics
- 3.4.3 Consumer response patterns
- 3.5 Key companies impacted
- 3.6 Strategic industry responses
- 3.6.1 Supply chain reconfiguration
- 3.6.2 Pricing and product strategies
- 3.6.3 Policy engagement
- 3.7 Outlook and future considerations
- 3.8 Supplier landscape
- 3.9 Profit margin analysis
- 3.10 Key news & initiatives
- 3.11 Regulatory framework and standards
- 3.11.1 Food safety regulations
- 3.11.2 Labeling requirements
- 3.11.3 Quality standards
- 3.11.4 Import/export regulations
- 3.11.5 Organic & clean label certifications
- 3.12 Impact forces
- 3.12.1 Growth drivers
- 3.12.1.1 Urbanization and evolving lifestyles
- 3.12.1.2 Technological advancements in processing and packaging
- 3.12.1.3 Retail expansion and government support
- 3.12.2 Industry pitfalls & challenges
- 3.12.2.1 Supply chain disruptions
- 3.12.2.2 Economic uncertainty
- 3.12.3 Market opportunities
- 3.12.1 Growth drivers
- 3.13 Product overview
- 3.13.1 Nonperishable milk processing technologies
- 3.13.2 Shelf-life extension methods
- 3.13.3 Nutritional profile comparison
- 3.13.4 Sensory characteristics
- 3.14 Manufacturing process analysis
- 3.14.1 UHT processing
- 3.14.2 Evaporation & Condensation
- 3.14.3 Spray drying
- 3.14.4 Aseptic packaging
- 3.14.5 Quality control processes
- 3.15 Raw material analysis & procurement strategies
- 3.16 Pricing analysis
- 3.17 Sustainability & environmental impact assessment
- 3.18 Growth potential analysis
- 3.19 Porter's analysis
- 3.20 PESTEL analysis
Chapter 4 Competitive Landscape, 2024
- 4.1 Introduction
- 4.2 Market share analysis
- 4.3 Strategic framework
- 4.3.1 Mergers & acquisitions
- 4.3.2 Joint ventures & collaborations
- 4.3.3 New product developments
- 4.3.4 Expansion strategies
- 4.4 Competitive benchmarking
- 4.5 Vendor landscape
- 4.6 Competitive positioning matrix
- 4.7 Strategic dashboard
- 4.8 Brand positioning & consumer perception analysis
- 4.9 Market entry strategies for new players
- 4.10 Private label analysis & strategies
Chapter 5 Market Estimates and Forecast, By Product Type, 2021 - 2034 (USD Billion) (Kilo Tons)
- 5.1 Key trends
- 5.2 UHT (Ultra-High Temperature) milk
- 5.2.1 Whole UHT milk
- 5.2.2 Semi-skimmed UHT milk
- 5.2.3 Skimmed UHT milk
- 5.2.4 Flavored UHT milk
- 5.3 Evaporated milk
- 5.3.1 Whole evaporated milk
- 5.3.2 Skimmed evaporated milk
- 5.3.3 Others
- 5.4 Sweetened condensed milk
- 5.4.1 Regular sweetened condensed milk
- 5.4.2 Flavored sweetened condensed milk
- 5.4.3 Others
- 5.5 Sweetened condensed milk
- 5.5.1 Regular sweetened condensed milk
- 5.5.2 Flavored sweetened condensed milk
- 5.5.3 Others
- 5.6 Powdered milk
- 5.6.1 Whole milk powder
- 5.6.2 Skimmed milk powder
- 5.6.3 Fat-filled milk powder
- 5.6.4 Infant formula
- 5.6.5 Others
- 5.7 Others
Chapter 6 Market Estimates and Forecast, By Source, 2021 - 2034 (USD Billion) (Kilo Tons)
- 6.1 Key trends
- 6.2 Cow milk
- 6.3 Goat milk
- 6.4 Buffalo milk
- 6.5 Plant-based alternatives
- 6.5.1 Soy milk
- 6.5.2 Almond milk
- 6.5.3 Oat milk
- 6.5.4 Coconut milk
- 6.5.5 Others
- 6.6 Others
Chapter 7 Market Estimates and Forecast, By Fat Content, 2021 - 2034 (USD Billion) (Kilo Tons)
- 7.1 Key trends
- 7.2 Whole/full fat (≥3.5% Fat)
- 7.3 Semi-skimmed/reduced fat (1.5-1.8% Fat)
- 7.4 Skimmed/low fat (≤0.5% Fat)
- 7.5 Fat-free (0% Fat)
- 7.6 Variable fat content
Chapter 8 Market Estimates and Forecast, By Packaging Type, 2021 - 2034 (USD Billion) (Kilo Tons)
- 8.1 Key trends
- 8.2 Tetra packs/aseptic cartons
- 8.2.1 Brick cartons
- 8.2.2 Gable top cartons
- 8.2.3 Others
- 8.3 Cans
- 8.3.1 Steel cans
- 8.3.2 Aluminum cans
- 8.4 Bottles
- 8.4.1 Glass bottles
- 8.4.2 Plastic bottles
- 8.5 Pouches
- 8.6 Bag-in-box
- 8.7 Tins & sachets (for Powdered Milk)
- 8.8 Others
Chapter 9 Market Estimates and Forecast, By Distribution Channel, 2021 - 2034 (USD Billion) (Kilo Tons)
- 9.1 Key trends
- 9.2 Supermarkets & hypermarkets
- 9.3 Specialty stores
- 9.4 Convenience stores
- 9.5 Online retail
- 9.5.1 Company websites
- 9.5.2 E-commerce platforms
- 9.5.3 Subscription services
- 9.6 Foodservice
- 9.6.1 Hotels & restaurants
- 9.6.2 Cafes & bakeries
- 9.6.3 Institutional catering
- 9.7 Direct sales (B2B)
- 9.8 Others
Chapter 10 Market Estimates and Forecast, By End Use, 2021 - 2034 (USD Billion) (Kilo Tons)
- 10.1 Key trends
- 10.2 Direct consumption
- 10.3 Food processing
- 10.3.1 Bakery & confectionery
- 10.3.2 Dairy products
- 10.3.3 Infant food
- 10.3.4 Prepared foods
- 10.3.5 Others
- 10.4 Beverage industry
- 10.4.1 Coffee & tea
- 10.4.2 Smoothies & shakes
- 10.4.3 Others
- 10.5 Food service industry
- 10.6 Nutritional supplements
- 10.7 Others
Chapter 11 Market Estimates and Forecast, By Region, 2021 - 2034 (USD Billion) (Kilo Tons)
- 11.1 Key trends
- 11.2 North America
- 11.2.1 U.S.
- 11.2.2 Canada
- 11.3 Europe
- 11.3.1 Germany
- 11.3.2 UK
- 11.3.3 France
- 11.3.4 Spain
- 11.3.5 Italy
- 11.3.6 Netherlands
- 11.3.7 Rest of Europe
- 11.4 Asia Pacific
- 11.4.1 China
- 11.4.2 India
- 11.4.3 Japan
- 11.4.4 Australia
- 11.4.5 South Korea
- 11.4.6 Rest of Asia Pacific
- 11.5 Latin America
- 11.5.1 Brazil
- 11.5.2 Mexico
- 11.5.3 Argentina
- 11.5.4 Rest of Latin America
- 11.6 Middle East and Africa
- 11.6.1 Saudi Arabia
- 11.6.2 South Africa
- 11.6.3 UAE
- 11.6.4 Rest of Middle East and Africa
Chapter 12 Company Profiles
- 12.1 Nestle S.A.
- 12.2 Danone S.A.
- 12.3 Lactalis Group
- 12.4 Fonterra Co-operative Group Limited
- 12.5 FrieslandCampina
- 12.6 Arla Foods amba
- 12.7 Dean Foods (Dairy Farmers of America)
- 12.8 Saputo Inc.
- 12.9 Parmalat S.p.A. (Lactalis)
- 12.10 Amul (Gujarat Cooperative Milk Marketing Federation)
- 12.11 China Mengniu Dairy Company Limited
- 12.12 Inner Mongolia Yili Industrial Group Co., Ltd.
- 12.13 Morinaga Milk Industry Co., Ltd.
- 12.14 Meiji Holdings Co., Ltd.
- 12.15 Savencia Fromage & Dairy
- 12.16 DMK Deutsches Milchkontor GmbH
- 12.17 Muller Group
- 12.18 Dairy Farmers of America, Inc.
- 12.19 Almarai Company
- 12.20 Grupo LALA
- 12.21 Vinamilk (Vietnam Dairy Products JSC)
- 12.22 Borden Dairy Company
- 12.23 Dairy Partners Americas (DPA)
- 12.24 Darigold, Inc.
- 12.25 California Dairies, Inc.
- 12.26 Sodiaal
- 12.27 Glanbia plc
- 12.28 Schreiber Foods Inc.
- 12.29 Land O'Lakes, Inc.
- 12.30 Dairy Crest Group plc (Saputo)

