
PUBLISHER: Global Market Insights Inc. | PRODUCT CODE: 1750509

PUBLISHER: Global Market Insights Inc. | PRODUCT CODE: 1750509
Radar Absorbing Materials Market Opportunity, Growth Drivers, Industry Trend Analysis, and Forecast 2025 - 2034
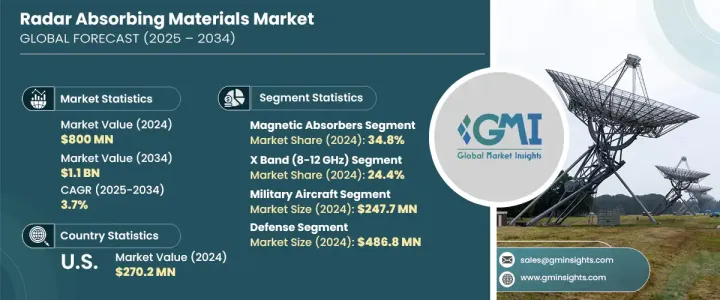
The Global Radar Absorbing Materials Market was valued at USD 800 million in 2024 and is estimated to grow at a CAGR of 3.7% to reach USD 1.1 billion by 2034 due to defense spending and rising tensions around the globe. Modern defense technologies, particularly in stealth, have pushed demand for materials that minimize radar detection. With both military and increasingly civilian sectors looking to reduce radar cross-section signatures, RAM materials are becoming an integral part of advanced systems. The ongoing focus on lightweight composites with enhanced thermal and mechanical performance drives innovations, especially with advanced materials like graphene and carbon nanotubes.
Manufacturers are investing in multi-functional RAM that delivers superior performance across broader frequency bands, while maintaining low weight and high durability. Environmentally safer alternatives are also under development, responding to growing concerns around chemical compositions used in traditional RAM. Meanwhile, academic institutions and defense partnerships accelerate discovery cycles through research collaborations. Established companies and new players face pressure to produce cost-effective solutions to expand their applicability beyond exclusive military platforms and into broader commercial uses.
| Market Scope | |
|---|---|
| Start Year | 2024 |
| Forecast Year | 2025-2034 |
| Start Value | $800 Million |
| Forecast Value | $1.1 Billion |
| CAGR | 3.7% |
Among the various frequency bands, the X band accounted for USD 195 million in 2024 and is projected to grow at a 4.7% CAGR through 2034. This band remains highly relevant due to its critical role in tracking, weather radar, and targeting systems in airborne and unmanned platforms. Other frequency ranges, such as the L and S bands, are gaining traction in naval and airborne surveillance, while C band usage continues to hold importance in air traffic and ground control systems. Radar-absorbing materials tailored for specific frequency operations are essential in achieving optimal stealth capabilities across domains.
In terms of application, military aircraft generated USD 247.7 million in 2024, expected to grow at a CAGR of 4.3%. Stealth-enabled aircraft remain key consumers of RAM, particularly as air superiority continues to dominate future combat strategies. Naval ships also deploy these materials to mask superstructures and critical systems, while land-based vehicles and mobile command platforms are increasingly integrating RAM to operate undetected in radar-heavy environments.
United States Radar Absorbing Materials Market stood at USD 270.2 million in 2024, supported by a strong defense industry and advanced R&D activities. Innovations are not only being used in military platforms but are also transitioning into civilian technologies such as autonomous navigation, telecom infrastructure, and aerospace shielding. Companies are integrating high-frequency absorbing materials into automotive sensors and next-gen communication devices.
To boost market share, companies like SLTL Group, Saab, Micromag, and 3M are adopting strategies centered on material innovation and frequency versatility. They invest in hybrid composites, metamaterials, and dielectric structures to meet multi-platform demands. Collaborations with defense bodies, emphasis on sustainable manufacturing, and cost optimization remain central to their long-term competitive positioning.
Table of Contents
Chapter 1 Methodology & Scope
- 1.1 Market scope & definitions
- 1.2 Base estimates & calculations
- 1.3 Forecast calculations
- 1.4 Data sources
- 1.4.1 Primary
- 1.4.2 Secondary
- 1.4.2.1 Paid sources
- 1.4.2.2 Public sources
Chapter 2 Executive Summary
- 2.1 Industry synopsis, 2021-2034
Chapter 3 Industry Insights
- 3.1 Industry ecosystem analysis
- 3.1.1 Factor affecting the value chain
- 3.1.2 Profit margin analysis
- 3.1.3 Disruptions
- 3.1.4 Future outlook
- 3.1.5 Manufacturers
- 3.1.6 Distributors
- 3.2 Trump administration tariffs
- 3.2.1 Impact on trade
- 3.2.1.1 Trade volume disruptions
- 3.2.1.2 Retaliatory measures
- 3.2.2 Impact on the industry
- 3.2.2.1 Supply-side impact (raw materials)
- 3.2.2.1.1 Price volatility in key materials
- 3.2.2.1.2 Supply chain structure
- 3.2.2.1.3 Production cost implications
- 3.2.2.1 Supply-side impact (raw materials)
- 3.2.3 Demand-side impact (selling price)
- 3.2.3.1 Price transmission to end markets
- 3.2.3.2 Market share dynamics
- 3.2.3.3 Consumer response patterns
- 3.2.4 Key companies impacted
- 3.2.5 Strategic industry responses
- 3.2.5.1 Supply chain reconfiguration
- 3.2.5.2 Pricing and product strategies
- 3.2.5.3 Policy engagement
- 3.2.6 Outlook and future considerations
- 3.2.1 Impact on trade
- 3.3 Trade statistics (HS code) Note: the above trade statistics will be provided for key countries only.
- 3.3.1 Major exporting countries, 2021-2024 (kilo tons)
- 3.3.2 Major importing countries, 2021-2024 (kilo tons)
- 3.4 Supplier landscape
- 3.5 Profit margin analysis
- 3.6 Key news & initiatives
- 3.7 Regulatory landscape
- 3.8 Impact forces
- 3.8.1 Growth drivers
- 3.8.1.1 Rising defense expenditures and stealth technology adoption
- 3.8.1.2 Technological advancements in material science
- 3.8.1.3 Expansion of unmanned aerial vehicles (UAVS) and drones
- 3.8.1.4 Integration of RAM in civilian and automotive radar systems
- 3.8.2 Industry pitfalls & challenges
- 3.8.2.1 High manufacturing costs and complex production processes
- 3.8.2.2 Environmental and durability concerns
- 3.8.1 Growth drivers
- 3.9 Market opportunities
- 3.10 Growth potential analysis
- 3.11 Regulatory framework analysis
- 3.11.1 Reach and ROHS regulations
- 3.11.2 Export control regulations
- 3.11.3 Environmental compliance requirements
- 3.11.4 Safety standards for handling and processing
- 3.12 Technology landscape
- 3.12.1 Current technological trends
- 3.12.2 Emerging technologies
- 3.12.3 R&D initiatives and innovation pipeline
- 3.12.4 Patent analysis
- 3.13 Porter's analysis
- 3.14 PESTEL analysis
Chapter 4 Competitive Landscape, 2024
- 4.1 Introduction
- 4.2 Market share analysis
- 4.2.1 Strategic Framework
- 4.2.2 Mergers & acquisitions
- 4.2.3 Joint ventures & collaborations
- 4.2.4 New product developments
- 4.2.5 Expansion strategies
- 4.3 Competitive benchmarking
- 4.4 Vendor landscape
- 4.5 Competitive positioning matrix
- 4.6 Strategic dashboard
- 4.7 Patent analysis & innovation assessment
- 4.8 Market entry strategies for new players
- 4.9 Research & development intensity analysis
Chapter 5 Market Estimates & Forecast, By Material Type, 2021-2034 (USD Million) (Kilo Tons)
- 5.1 Key trends
- 5.2 Magnetic absorbers
- 5.2.1 Ferrites
- 5.2.2 Carbonyl iron
- 5.2.3 Others
- 5.3 Dielectric absorbers
- 5.3.1 Carbon-based materials
- 5.3.2 Conductive polymers
- 5.3.3 Others
- 5.4 Hybrid absorbers
- 5.4.1 Magnetic-dielectric composites
- 5.4.2 Multilayer structures
- 5.4.3 Others
- 5.5 Impedance matching materials
- 5.6 Metamaterial absorbers
- 5.7 Frequency selective surfaces
- 5.8 Others
Chapter 6 Market Estimates & Forecast, By Form, 2021-2034 (USD Million) (Kilo Tons)
- 6.1 Key trends
- 6.1.1 Coatings & paints
- 6.1.2 Sprayable coatings
- 6.1.3 Brush-applied coatings
- 6.1.4 Others
- 6.2 Sheets & films
- 6.3 Foams & honeycombs
- 6.4 Tiles & panels
- 6.5 Molded components
- 6.6 Others
Chapter 7 Market Estimates & Forecast, By Frequency Range, 2021-2034 (USD Million) (Kilo Tons)
- 7.1 Key trends
- 7.2 Low frequency (< 1 GHZ)
- 7.3 L & s bands (1-4 GHz)
- 7.4 C band (4-8 GHz)
- 7.5 X band (8-12 GHz)
- 7.6 Ku, k & ka bands (12-40 GHz)
- 7.7 Millimeter wave (> 40 GHz)
- 7.8 Broadband (multiple frequency ranges)
Chapter 8 Market Estimates & Forecast, By Application, 2021-2034 (USD Million) (Kilo Tons)
- 8.1 Key trends
- 8.2 Military aircraft
- 8.2.1 Combat aircraft
- 8.2.2 Bombers
- 8.2.3 Unmanned aerial vehicles (UAVS)
- 8.2.4 Others
- 8.3 Naval vessels
- 8.3.1 Surface ships
- 8.3.2 Submarines
- 8.3.3 Others
- 8.4 Ground vehicles & systems
- 8.4.1 Armoured vehicles
- 8.4.2 Mobile radar systems
- 8.4.3 Others
- 8.5 Missiles & projectiles
- 8.6 Fixed installations
- 8.6.1 Command centers
- 8.6.2 Radar facilities
- 8.6.3 Others
- 8.7 Civilian applications
- 8.7.1 EMI/RFI shielding
- 8.7.2 Telecommunications
- 8.7.3 Anechoic chambers
- 8.7.4 Others
- 8.8 Others
Chapter 9 Market Estimates & Forecast, By End Use Industry, 2021-2034 (USD Million) (Kilo Tons)
- 9.1 Key trends
- 9.2 Defense
- 9.2.1 Air Force
- 9.2.2 Navy
- 9.2.3 Army
- 9.2.4 Others
- 9.3 Aerospace
- 9.3.1 Military aerospace
- 9.3.2 Commercial aerospace
- 9.3.3 Space applications
- 9.4 Electronics & telecommunications
- 9.5 Automotive
- 9.6 Research & academia
- 9.7 Others
Chapter 10 Market Estimates & Forecast, By Region, 2021-2034 (USD Million) (Kilo Tons)
- 10.1 Key trends
- 10.2 North America
- 10.2.1 U.S.
- 10.2.2 Canada
- 10.3 Europe
- 10.3.1 UK
- 10.3.2 Germany
- 10.3.3 France
- 10.3.4 Italy
- 10.3.5 Spain
- 10.3.6 Rest of Europe
- 10.4 Asia Pacific
- 10.4.1 China
- 10.4.2 India
- 10.4.3 Japan
- 10.4.4 South Korea
- 10.4.5 Australia
- 10.4.6 Rest of Asia Pacific
- 10.5 Latin America
- 10.5.1 Brazil
- 10.5.2 Mexico
- 10.5.3 Argentina
- 10.5.4 Rest of Latin America
- 10.6 MEA
- 10.6.1 South Africa
- 10.6.2 Saudi Arabia
- 10.6.3 UAE
- 10.6.4 Rest of Middle East and Africa
Chapter 11 Company Profiles
- 11.1 3M
- 11.2 L3Harris Technologies
- 11.3 Laird Technologies
- 11.4 MAJR Products
- 11.5 Micromag
- 11.6 Saab
- 11.7 Sltl Group
- 11.8 Soliani Emc
- 11.9 Thales
- 11.10 Trelleborg
- 11.11 Wittenburggroup

