
PUBLISHER: Global Market Insights Inc. | PRODUCT CODE: 1750579

PUBLISHER: Global Market Insights Inc. | PRODUCT CODE: 1750579
Erythritol Market Opportunity, Growth Drivers, Industry Trend Analysis, and Forecast 2025 - 2034
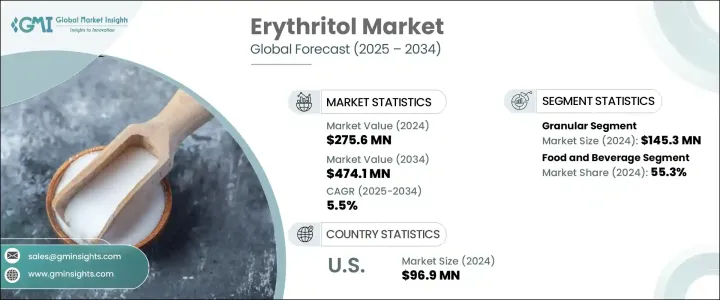
The Global Erythritol Market was valued at USD 275.6 million in 2024 and is estimated to grow at a CAGR of 5.5% to reach USD 474.1 million by 2034, driven by the health awareness among consumers and the demand for low-calorie and sugar-free products. As more individuals turn to healthier lifestyles, erythritol has gained popularity as a sugar substitute in foods and beverages such as baked goods, confectionery, and beverages. This trend is especially notable in Europe and North America, where the shift toward sugar alternatives has spurred significant market expansion. In addition, the increasing adoption of erythritol in emerging markets across Asia-Pacific and Latin America further supports its continued growth. As these regions grow economically and health-conscious consumer habits evolve, erythritol's market penetration is expected to increase consistently.
The market benefits from the rise in natural and plant-based food ingredients, which align with the growing demand for healthier and more sustainable options. Erythritol, as a plant-derived sugar alcohol, fits seamlessly into this trend, gaining favor with consumers seeking alternatives to traditional sugars. The overall growth of the market reflects the global push toward healthier living, driving sustained demand for sugar substitutes like erythritol.
| Market Scope | |
|---|---|
| Start Year | 2024 |
| Forecast Year | 2025-2034 |
| Start Value | $275.6 Million |
| Forecast Value | $474.1 Million |
| CAGR | 5.5% |
In 2024, the granular segment of the erythritol market was valued at USD 145.3 million and is projected to grow at a CAGR of 5.6% from 2025 to 2034 due to its ease of use and versatility in various applications, especially in food and beverage manufacturing. It closely resembles sugar in both texture and sweetness, making it ideal for baked goods, beverages, and confectionery. Its ability to be measured and mixed easily in recipes also contributes to its widespread adoption in residential and commercial settings. The granular form is particularly favored for its ability to deliver a sugar-like taste without the added calories, offering a healthier alternative for consumers.
The food & beverage sector, which accounted for USD 152.4 million in 2024 and is expected to grow at a CAGR of 5.7% through 2034. The demand for erythritol in this sector is driven by increasing consumer preference for healthier, low-calorie, and sugar-free products. Erythritol's low glycemic index, along with its ability to withstand high heat during baking, makes it an ideal choice for creating a wide range of food products, from cookies to cakes and pastries.
United States Erythritol Market was valued at USD 96.9 million in 2024, with a projected growth rate of 5.5% CAGR through 2034. The demand is strong in regions like the Northeast and West, driven by the popularity of low-carb and ketogenic diets. The growing awareness of the health risks associated with sugar consumption has led to increased use of erythritol in processed foods, beverages, and snacks, fueling market growth.
Key players in the Global Erythritol Market include Foodchem International Corporation, Tate & Lyle, Cargill, Jungbunzlauer Suisse AG, and Shandong Sanyuan Biotechnology. Companies are strengthening their positions by focusing on product innovation, expanding distribution channels, and investing in developing sustainable production methods to cater to the growing demand for natural sweeteners. To enhance their presence in the erythritol market, companies are adopting several key strategies. These include focusing on technological advancements in production processes to improve efficiency and reduce costs, as well as expanding their product portfolios to offer a wider range of sugar alternatives. Additionally, leading manufacturers are forming strategic partnerships with key players in the food and beverage sector to enhance market access and reach new consumer segments.
Table of Contents
Chapter 1 Methodology & Scope
- 1.1 Research methodology
- 1.2 Research approach & data sources
- 1.2.1 Primary research
- 1.2.2 Secondary research
- 1.2.3 Market size estimation techniques
- 1.2.4 Forecasting methodology
- 1.3 Research scope & assumptions
- 1.4 Market definition & segmentation
- 1.5 Limitations & challenges
- 1.6 Data validation & triangulation approach
Chapter 2 Executive Summary
- 2.1 Market overview & key findings
- 2.2 Market dynamics summary
- 2.3 Regional market highlights
- 2.4 Segmental performance overview
- 2.5 Competitive landscape snapshot
- 2.6 Future market outlook
- 2.7 Investment feasibility matrix
Chapter 3 Industry Insights
- 3.1 Industry ecosystem analysis
- 3.1.1 Factor affecting the value chain
- 3.1.2 Profit margin analysis
- 3.1.3 Disruptions
- 3.1.4 Future outlook
- 3.1.5 Manufacturers
- 3.1.6 Distributors
- 3.2 Trump administration tariffs
- 3.2.1 Impact on trade
- 3.2.1.1 Trade volume disruptions
- 3.2.1.2 Retaliatory measures
- 3.2.2 Impact on the industry
- 3.2.2.1 Supply-side impact (raw materials)
- 3.2.2.1.1 Price volatility in key materials
- 3.2.2.1.2 Supply chain restructuring
- 3.2.2.1.3 Production cost implications
- 3.2.2.1 Supply-side impact (raw materials)
- 3.2.3 Demand-side impact (selling price)
- 3.2.3.1 Price transmission to end markets
- 3.2.3.2 Market share dynamics
- 3.2.3.3 Consumer response patterns
- 3.2.4 Key companies impacted
- 3.2.5 Strategic industry responses
- 3.2.5.1 Supply chain reconfiguration
- 3.2.5.2 Pricing and product strategies
- 3.2.5.3 Policy engagement
- 3.2.6 Outlook and future considerations
- 3.2.1 Impact on trade
- 3.3 Trade statistics (HS code)
- 3.3.1 Major exporting countries, 2021-2024
- 3.3.2 Major importing countries, 2021-2024
- 3.4 Supplier landscape
- 3.5 Profit margin analysis
- 3.6 Key news & initiatives
- 3.7 Regulatory landscape
- 3.7.1 FDA regulations & GRAS status
- 3.7.2 European food safety authority (EFSA) guidelines
- 3.7.3 Asia-Pacific regulatory environment
- 3.7.4 International standards & certifications
- 3.8 Impact forces
- 3.8.1 Growth drivers
- 3.8.1.1 Increasing demand for low-calorie and sugar-free food products
- 3.8.1.2 Rising health consciousness among consumers
- 3.8.1.3 Growth of plant-based and natural food ingredient trends
- 3.8.1.4 Popularity of ketogenic and low-carb diets
- 3.8.2 Industry pitfalls & challenges
- 3.8.2.1 High production costs compared to other sweeteners
- 3.8.2.2 Limited consumer awareness in emerging markets
- 3.8.1 Growth drivers
- 3.9 Trade analysis
- 3.9.1 Import-export scenario
- 3.9.2 Tariff & non-tariff barriers
- 3.9.3 Anti-dumping measures & trade disputes
- 3.9.4 Free trade agreements impact
- 3.10 Technology landscape
- 3.10.1 Current production technologies
- 3.10.2 Fermentation process innovations
- 3.10.3 Purification & crystallization techniques
- 3.10.4 Emerging technologies & patents
- 3.11 Pricing Analysis
- 3.11.1 Price trends 2021-2024
- 3.11.2 Cost structure analysis
- 3.11.3 Pricing strategy assessment
- 3.11.4 Regional price variations
- 3.12 Value chain analysis
- 3.12.1 Raw material sourcing & suppliers
- 3.12.2 Manufacturing & processing
- 3.12.3 Distribution channels
- 3.12.4 End use applications
- 3.13 Industry impact analysis
- 3.13.1 Covid-19 impact assessment
- 3.13.2 Russia-Ukraine war implications
- 3.13.3 Economic recession factors
- 3.13.4 Supply chain disruptions
- 3.14 Growth potential analysis
- 3.15 Porter's analysis
- 3.16 PESTEL analysis
- 3.16.1 Political factors
- 3.16.2 Economic influences
- 3.16.3 Social trends
- 3.16.4 Technological innovations
- 3.16.5 Legal & regulatory framework
- 3.16.6 Environmental considerations
Chapter 4 Competitive Landscape, 2024
- 4.1 Introduction
- 4.2 Company market share analysis
- 4.2.1 Global market share distribution
- 4.2.2 Regional market share analysis
- 4.2.3 Tier analysis of key players
- 4.3 Competitive benchmarking
- 4.3.1 Product portfolio comparison
- 4.3.2 Production capacity assessment
- 4.3.3 Pricing strategy comparison
- 4.3.4 Distribution network strength
- 4.3.5 R&D capabilities & innovation
- 4.4 Strategic initiatives
- 4.4.1 Mergers & acquisitions
- 4.4.2 Joint ventures & partnerships
- 4.4.3 Capacity expansions
- 4.4.4 New product launches
- 4.4.5 Technological collaborations
- 4.5 Competitive positioning matrix
- 4.5.1 Market leaders
- 4.5.2 Emerging players
- 4.5.3 Innovators
- 4.5.4 Niche players
- 4.6 Strategic dashboard
Chapter 5 Market Estimates & Forecast, By Form, 2021-2034 (USD Billion) (Kilo Tons)
- 5.1 Key trends
- 5.2 Powder
- 5.3 Granular
- 5.4 Liquid
Chapter 6 Market Estimates & Forecast, By Purity Level, 2021-2034 (USD Billion) (Kilo Tons)
- 6.1 Key trends
- 6.2 High purity (=>99%)
- 6.3 Standard purity (95-98%)
- 6.4 Others
Chapter 7 Market Estimates & Forecast, By Application, 2021-2034 (USD Billion) (Kilo Tons)
- 7.1 Key trends
- 7.2 Food and beverages
- 7.2.1 Bakery & confectionery
- 7.2.2 Beverages
- 7.2.3 Dairy products
- 7.2.4 Frozen desserts
- 7.2.5 Others
- 7.3 Pharmaceutical
- 7.3.1 Tablets & capsules
- 7.3.2 Syrups & suspensions
- 7.3.3 Others
- 7.4 Personal care and cosmetics
- 7.4.1 Oral care products
- 7.4.2 Skin care products
- 7.4.3 Others
- 7.5 Others
- 7.5.1 Agricultural applications
- 7.5.2 Industrial uses
Chapter 8 Market Estimates & Forecast, By Region, 2021-2034 (USD Billion) (Kilo Tons)
- 8.1 Key trends
- 8.2 North America
- 8.2.1 U.S.
- 8.2.2 Canada
- 8.2.3 Mexico
- 8.3 Europe
- 8.3.1 UK
- 8.3.2 Germany
- 8.3.3 France
- 8.3.4 Italy
- 8.3.5 Spain
- 8.3.6 Russia
- 8.4 Asia Pacific
- 8.4.1 China
- 8.4.2 India
- 8.4.3 Japan
- 8.4.4 South Korea
- 8.4.5 Australia
- 8.5 Latin America
- 8.5.1 Brazil
- 8.5.2 Argentina
- 8.6 MEA
- 8.6.1 South Africa
- 8.6.2 Saudi Arabia
- 8.6.3 UAE
Chapter 9 Company Profiles
- 9.1 Baolingbao Biology Co., Ltd.
- 9.2 Cargill, Inc.
- 9.3 Changzhou Niutang Chemical Plant Co., Ltd.
- 9.4 Foodchem International Corporation
- 9.5 Futaste Co., Ltd.
- 9.6 Ingredion Incorporated
- 9.7 Jungbunzlauer Suisse AG
- 9.8 Mitsubishi Chemical Group Corporation
- 9.9 Nikken Chemical Co., Ltd.
- 9.10 RAJVI ENTERPRISE
- 9.11 Shandong Sanyuan Biotechnology Co., Ltd.
- 9.12 Tate & Lyle PLC
- 9.13 Xiwang Group
- 9.14 Zibo ZhongShi GeRui Biotech Co., Ltd.

