
PUBLISHER: Global Market Insights Inc. | PRODUCT CODE: 1750584

PUBLISHER: Global Market Insights Inc. | PRODUCT CODE: 1750584
Beverage Premix Market Opportunity, Growth Drivers, Industry Trend Analysis, and Forecast 2025 - 2034
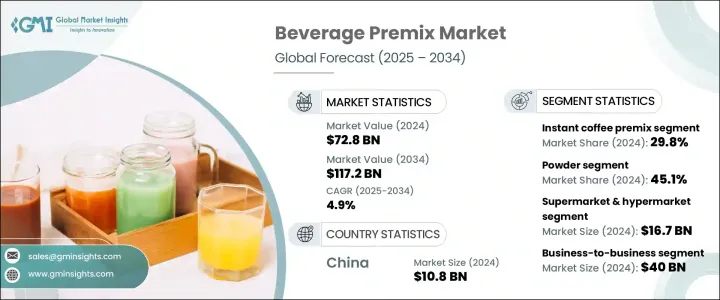
The Global Beverage Premix Market was valued at USD 72.8 billion in 2024 and is estimated to grow at a CAGR of 4.9% to reach USD 117.2 billion by 2034, driven by the rising popularity of convenient, health-focused beverages. These products appeal to consumers who are looking for quick, easy-to-prepare drinks without compromising on taste or nutrition. Beverage premixes-available in powder or liquid form-offer a fast solution that only requires water or milk. With increasingly busy lifestyles and a growing preference for portable wellness, premixes are gaining traction across multiple segments, including homes, offices, gyms, vending machines, and institutional catering.
Consumers are becoming more health-conscious, fueling interest in functional beverages that support energy, digestion, immunity, and weight control. Fortified ingredients such as whey protein, herbal extracts, superfoods, and vitamins are becoming commonplace in formulations. Innovations in solubility, flavor consistency, and extended shelf life have further improved product quality, encouraging repeat purchases. The rise of the educated urban working population and the global shift toward wellness have positioned beverage premixes as a reliable, on-the-go option.
| Market Scope | |
|---|---|
| Start Year | 2024 |
| Forecast Year | 2025-2034 |
| Start Value | $72.8 Billion |
| Forecast Value | $117.2 Billion |
| CAGR | 4.9% |
Instant coffee premix held a dominant market share of 29.8% in 2024 and is expected to expand at a CAGR of 4.7% through 2034. Its long shelf life, global appeal, and easy preparation process continue to drive adoption across sectors such as corporate offices, hospitality, and travel. Consumers use these options for premium coffee experiences at home or work. Meanwhile, flavored tea premixes are experiencing increased demand, particularly in regions with traditional tea-drinking habits. Instant milk premixes are gaining popularity among families for their quick nutritional value, especially for children and older adults. The health drink segment is also rapidly emerging due to consumer interest in immunity, fitness, and clean-label ingredients fortified with nutrients and botanicals.
Powdered premixes accounted for 45.1% share in 2024 and are projected to grow at a 4.9% CAGR over the forecast period. Their appeal lies in affordability, ease of storage and transport, and customizable portion sizes. Powder formulations offer greater flexibility for integrating functional ingredients and are widely compatible with coffee, tea, milk, and health beverages. Their continued dominance is supported by rising consumer demand for nutritional convenience across developed and developing markets.
China Beverage Premix Market generated USD 10.8 billion in 2024 and is projected to grow at a 5% CAGR by 2034. The country's vast population, accelerating urbanization, and evolving consumer preferences are driving increased adoption of beverage premixes. With a fast-paced lifestyle and growing middle-class spending power, Chinese consumers purchase ready-to-mix products. The region's evolving beverage culture and interest in innovative drinks accelerate market growth.
Top players in this market include PepsiCo, Inc., Nestle S.A., Keurig Dr Pepper Inc., The Coca-Cola Company, and Starbucks Corporation. To secure a stronger market presence, these companies are leveraging several strategic approaches. They are expanding their product portfolios to include wellness-oriented and fortified options, targeting specific consumer health needs. Many invest in R&D to improve solubility, flavor accuracy, and shelf life. In addition, strategic collaborations with foodservice operators and tech-driven vending solutions are helping increase accessibility. Some firms emphasize premiumization and eco-friendly packaging to align with consumer values and market expectations.
Table of Contents
Chapter 1 Methodology & Scope
- 1.1 Market scope & definition
- 1.2 Base estimates & calculations
- 1.3 Forecast calculation
- 1.4 Data sources
- 1.4.1 Primary
- 1.4.2 Secondary
- 1.4.2.1 Paid sources
- 1.4.2.2 Public sources
- 1.5 Primary research and validation
- 1.5.1 Primary sources
- 1.5.2 Data mining sources
Chapter 2 Executive Summary
- 2.1 Industry synopsis, 2021-2034
Chapter 3 Industry Insights
- 3.1 Industry ecosystem analysis
- 3.2 Trump administration tariffs
- 3.2.1 Impact on trade
- 3.2.1.1 Trade volume disruptions
- 3.2.1.2 Retaliatory measures
- 3.2.2 Impact on the industry
- 3.2.2.1 Supply-side impact (raw materials)
- 3.2.2.1.1 Price volatility in key materials
- 3.2.2.1.2 Supply chain restructuring
- 3.2.2.1.3 Production cost implications
- 3.2.2.2 Demand-side impact (selling price)
- 3.2.2.2.1 Price transmission to end markets
- 3.2.2.2.2 Market share dynamics
- 3.2.2.2.3 Consumer response patterns
- 3.2.2.1 Supply-side impact (raw materials)
- 3.2.3 Key companies impacted
- 3.2.4 Strategic industry responses
- 3.2.4.1 Supply chain reconfiguration
- 3.2.4.2 Pricing and product strategies
- 3.2.4.3 Policy engagement
- 3.2.5 Outlook and future considerations
- 3.2.1 Impact on trade
- 3.3 Trade statistics (HS Code) Note: the above trade statistics will be provided for key countries only.
- 3.3.1 Major exporting countries, 2021-2024 (Kilo Tons)
- 3.3.2 Major importing countries, 2021-2024 (Kilo Tons)
- 3.4 Value chain analysis
- 3.5 Raw material analysis
- 3.6 Key ingredients
- 3.6.1 Sourcing patterns
- 3.6.2 Price trends
- 3.6.3 Supply chain challenges
- 3.7 Manufacturing process analysis
- 3.7.1 Formulation and blending techniques
- 3.7.2 Mixing and processing technologies
- 3.7.3 Quality control measures
- 3.7.4 Packaging processes
- 3.8 Market dynamics
- 3.8.1 Market drivers
- 3.8.1.1 Convenience and time-saving benefits
- 3.8.1.2 Growing demand from quick service restaurants
- 3.8.1.3 Rising health consciousness
- 3.8.1.4 Increasing urbanization and busy lifestyles
- 3.8.2 Market restraints
- 3.8.2.1 Stringent regulatory framework
- 3.8.2.2 Fluctuating raw material prices
- 3.8.2.3 Concerns regarding artificial ingredients
- 3.8.2.4 Competition of ready-to-drink beverages
- 3.8.3 Market opportunities
- 3.8.3.1 Growing demand for functional beverages
- 3.8.3.2 Expansion in emerging markets
- 3.8.3.3 Innovation in flavors and ingredients
- 3.8.3.4 E-commerce and direct-to-consumer channels
- 3.8.4 Market challenges
- 3.8.4.1 Maintaining product consistency
- 3.8.4.2 Addressing clean label demands
- 3.8.4.3 Sustainability concerns
- 3.8.4.4 Adapting to regional taste preferences
- 3.8.1 Market drivers
- 3.9 Industry impact forces
- 3.9.1 Growth drivers
- 3.9.1.1 Increasing health benefits of green tea and healthy drinks
- 3.9.1.2 Rising popularity of convenience drinks
- 3.9.1.3 High rate of consumption of instant coffee
- 3.9.2 Industry pitfalls and challenges
- 3.9.2.1 Maintaining strict guidelines and diverse regulations around the world
- 3.9.2.2 Health issues caused by excessive consumption
- 3.9.1 Growth drivers
- 3.10 Regulatory framework analysis
- 3.10.1 Food safety regulations
- 3.10.2 Labeling requirements
- 3.10.3 Ingredient standards and restrictions
- 3.10.4 Import/export regulations
- 3.10.5 Regional regulatory differences
- 3.11 Technology landscape
- 3.11.1 Current technological trends
- 3.11.2 Automation in production
- 3.11.3 Innovations in formulation
- 3.11.4 Digital solutions in supply chain management
- 3.12 Pricing analysis
- 3.12.1 Price trend analysis
- 3.12.2 Cost structure analysis
- 3.12.3 Factors affecting pricing
- 3.12.4 Regional price variations
- 3.13 Sustainability and future trends
- 3.13.1 Sustainable packaging innovations
- 3.13.1.1 Eco-friendly materials
- 3.13.1.2 Recyclable packaging solutions
- 3.13.1.3 Biodegradable options
- 3.13.1.4 Reduced packaging waste initiatives
- 3.13.2 Clean label and natural ingredients
- 3.13.2.1 Plant-based ingredients
- 3.13.2.2 Organic certifications
- 3.13.2.3 Non-GMO trends
- 3.13.2.4 Allergen-free formulations
- 3.13.3 Digital transformation
- 3.13.3.1 Smart packaging technologies
- 3.13.3.2 Iot in production and distribution
- 3.13.3.3 Blockchain for traceability
- 3.13.3.4 Ai and machine learning applications
- 3.13.4 Emerging consumer preferences
- 3.13.4.1 Personalization and customization
- 3.13.4.2 Functional benefits
- 3.13.4.3 Experiential consumption
- 3.13.4.4 Health and wellness focus
- 3.13.1 Sustainable packaging innovations
- 3.14 PESTLE Analysis
- 3.15 Porter's five forces analysis
Chapter 4 Competitive landscape, 2024
- 4.1 Introduction
- 4.2 Strategic framework
- 4.2.1 Mergers & acquisitions
- 4.2.2 Joint ventures & collaborations
- 4.2.3 New product developments
- 4.2.4 Expansion strategies
- 4.3 Competitive benchmarking
- 4.4 Vendor landscape
- 4.5 Competitive positioning matrix
- 4.6 Strategic dashboard
- 4.7 Brand positioning & consumer perception analysis
- 4.8 Market entry strategies for new players
Chapter 5 Market Size and Forecast, By Product Type 2021 - 2034 (USD Billion, Kilo Tons)
- 5.1 Key trends
- 5.2 Instant coffee premix
- 5.2.1 Regular coffee
- 5.2.2 Flavored coffee
- 5.2.3 Specialty coffee
- 5.2.4 Others
- 5.3 Instant tea premix
- 5.3.1 Black tea
- 5.3.2 Green tea
- 5.3.3 Herbal tea
- 5.3.4 Flavored tea
- 5.3.5 Others
- 5.4 Instant milk premix
- 5.4.1 Plain milk
- 5.4.2 Flavored milk
- 5.4.3 Dairy alternatives
- 5.4.4 Others
- 5.5 Health drink premix
- 5.5.1 Protein drinks
- 5.5.2 Energy drinks
- 5.5.3 Functional beverages
- 5.5.4 Nutritional supplements
- 5.5.5 Others
- 5.6 Alcoholic beverage premix
- 5.6.1 Cocktail mixes
- 5.6.2 Wine mixes
- 5.6.3 Spirit-based mixes
- 5.6.4 Others
- 5.7 Soft drink premix
- 5.7.1 Carbonated drink mixes
- 5.7.2 Fruit-based drink mixes
- 5.7.3 Sports and energy drink mixes
- 5.7.4 Others
- 5.8 Others
Chapter 6 Market Size and Forecast, By Form, 2021 - 2034 (USD Billion, Kilo Tons)
- 6.1 Key trends
- 6.2 Powder
- 6.2.1 Instant powder
- 6.2.2 Granulated powder
- 6.2.3 Others
- 6.3 Paste
- 6.3.1 Concentrated paste
- 6.3.2 Ready-to-mix paste
- 6.3.3 Others
- 6.4 Liquid concentrate
- 6.4.1 Shelf-stable concentrate
- 6.4.2 Frozen concentrate
- 6.4.3 Others
- 6.5 Others
Chapter 7 Market Size and Forecast, By Function, 2021 - 2034 (USD Billion, Kilo Tons)
- 7.1 Key trend
- 7.2 Plain
- 7.2.1 Unflavored
- 7.2.2 Traditional
- 7.2.3 Others
- 7.3 Flavored
- 7.3.1 Fruit flavors
- 7.3.2 Chocolate and coffee flavors
- 7.3.3 Herbal and botanical flavors
- 7.3.4 Spice flavors
- 7.3.5 Others
- 7.4 Functional
- 7.4.1 Energy-boosting
- 7.4.2 Immunity-enhancing
- 7.4.3 Digestive health
- 7.4.4 Cognitive function
- 7.5 Others
- 7.6 Fortified
- 7.6.1 Vitamin-fortified
- 7.6.2 Mineral-fortified
- 7.6.3 Protein-fortified
- 7.6.4 Others
Chapter 8 Market Size and Forecast, By Distribution Channel, 2021 - 2034 (USD Billion, Kilo Tons)
- 8.1 Key trend
- 8.2 Business-to-business
- 8.2.1 HoReCa (hotels restaurants and cafes)
- 8.2.2 Quick service restaurants
- 8.2.3 Institutional catering
- 8.2.4 Others
- 8.3 Business-to-consumer
- 8.3.1 Supermarkets and hypermarkets
- 8.3.2 Convenience stores
- 8.3.3 Specialty stores
- 8.3.4 Online retail
- 8.3.5 Others
Chapter 9 Market Estimates and Forecast, By Region, 2021 - 2034 (USD Billion) (Kilo Tons)
- 9.1 Key trends
- 9.2 North America
- 9.2.1 U.S.
- 9.2.2 Canada
- 9.3 Europe
- 9.3.1 Germany
- 9.3.2 UK
- 9.3.3 France
- 9.3.4 Spain
- 9.3.5 Italy
- 9.3.6 Rest of Europe
- 9.4 Asia Pacific
- 9.4.1 China
- 9.4.2 India
- 9.4.3 Japan
- 9.4.4 Australia
- 9.4.5 South Korea
- 9.4.6 Rest of Asia Pacific
- 9.5 Latin America
- 9.5.1 Brazil
- 9.5.2 Mexico
- 9.5.3 Argentina
- 9.5.4 Rest of Latin America
- 9.6 Middle East and Africa
- 9.6.1 Saudi Arabia
- 9.6.2 South Africa
- 9.6.3 UAE
- 9.6.4 Rets of Middle East & Africa
Chapter 10 Company Profiles
- 10.1 Nestle S.A.
- 10.2 The Coca-Cola Company
- 10.3 PepsiCo, Inc.
- 10.4 Starbucks Corporation
- 10.5 Keurig Dr Pepper Inc.
- 10.6 Unilever PLC
- 10.7 Ajinomoto Co., Inc.
- 10.8 Monster Beverage Corporation
- 10.9 Suntory Holdings Limited
- 10.10 Tata Consumer Products Limited
- 10.11 Kraft Heinz Company
- 10.12 Mondelēz International, Inc.
- 10.13 Danone S.A.
- 10.14 Associated British Foods plc
- 10.15 Kerry Group plc
- 10.16 Ito En, Ltd.
- 10.17 Diageo plc
- 10.18 Bacardi Limited
- 10.19 Pernod Ricard
- 10.20 Red Bull GmbH
- 10.21 DSM-Firmenich AG
- 10.22 Givaudan SA
- 10.23 International Flavors & Fragrances Inc.
- 10.24 Symrise AG
- 10.25 Archer Daniels Midland Company
- 10.26 Cargill, Incorporated
- 10.27 Ingredion Incorporated
- 10.28 Tate & Lyle PLC
- 10.29 Nitin's Premixes
- 10.30 Veebha Beverages Private Limited

