
PUBLISHER: Global Market Insights Inc. | PRODUCT CODE: 1755241

PUBLISHER: Global Market Insights Inc. | PRODUCT CODE: 1755241
Silicon Photomultiplier Market Opportunity, Growth Drivers, Industry Trend Analysis, and Forecast 2025 - 2034
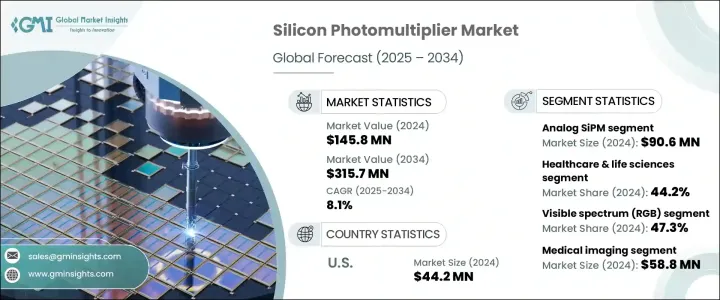
The Global Silicon Photomultiplier Market was valued at USD 145.8 million in 2024 and is estimated to grow at a CAGR of 8.1% to reach USD 315.7 million by 2034. The growth is driven by the increasing reliance on solid-state LiDAR technology in autonomous vehicle development, along with rising adoption in medical imaging applications such as PET and SPECT. SiPMs are favored for their high sensitivity, compact footprint, and fast response time essential in advanced driver-assistance systems and next-generation healthcare diagnostics. Progress and growing demand for real-time photon detection across sectors continue to grow.
Trade measures introduced in previous years significantly disrupted the SiPM supply chain, especially for US-based manufacturers. Increased import costs for essential components from overseas markets impacted production economics. Export limitations and reciprocal tariffs also made international sales more difficult for leading companies. However, this disruption created a push toward reshoring and developing domestic capabilities. U.S. players began investing more heavily in local production and R&D to strengthen resilience and reduce dependency on foreign suppliers. These shifts helped lay the foundation for a more self-sufficient supply network.
| Market Scope | |
|---|---|
| Start Year | 2024 |
| Forecast Year | 2025-2034 |
| Start Value | $145.8 Million |
| Forecast Value | $315.7 Million |
| CAGR | 8.1% |
The digital silicon photomultipliers segment is set to grow substantially, expected to reach USD 166.7 million by 2034. Digital variants are gaining popularity due to their advanced features like integrated signal processing, superior timing precision, and the ability to handle dense sensor arrays. Their increasing use in automotive LiDAR, photon counting, and time-of-flight imaging is driven by the demand for high-speed and high-resolution data acquisition systems.
In 2024, the healthcare and life sciences segment held a 44.2% share due to extensive SiPM deployment in medical diagnostic equipment like SPECT and PET scanners, as well as in applications such as flow cytometry and radiation detection. These devices depend on SiPMs for their exceptional imaging accuracy, reliability, and small form factor. Rising emphasis on early cancer detection, precision medicine, and molecular diagnostics continues to drive substantial demand from hospitals and research institutions.
United States Silicon Photomultiplier Market was valued at USD 44.2 million in 2024, supported by the country's strong position in medical imaging, national defense applications, and advanced research facilities. Key manufacturers such as Semiconductor Components Industries, LLC, and Excelitas Technologies Corp. lead innovation domestically. With increasing government investment in nuclear and radiation detection and a growing focus on digital healthcare, the U.S. will maintain steady growth in the years ahead.
Key players active in the Global Silicon Photomultiplier Market include Broadcom Inc., Hamamatsu Photonics K.K., Excelitas Technologies Corp., and Semiconductor Components Industries, LLC. These companies are strengthening their market position by investing in scalable manufacturing facilities, enhancing product miniaturization, and developing next-generation digital SiPM architectures. Strategic collaborations with research institutions and automotive OEMs are expanding application reach, while efforts to improve timing resolution and photon detection efficiency continue to push performance boundaries. Many of these players focus on improving cost efficiency through automation and vertical integration to meet increasing global demand while ensuring competitive pricing.
Table of Contents
Chapter 1 Methodology & Scope
- 1.1 Market scope & definitions
- 1.2 Base estimates & calculations
- 1.3 Forecast calculations
- 1.4 Data sources
- 1.4.1 Primary
- 1.4.2 Secondary
- 1.4.2.1 Paid sources
- 1.4.2.2 Public sources
Chapter 2 Executive Summary
- 2.1 Industry synopsis, 2021-2034
Chapter 3 Industry Insights
- 3.1 Industry ecosystem analysis
- 3.2 Trump administration tariffs analysis
- 3.2.1 Impact on trade
- 3.2.1.1 Trade volume disruptions
- 3.2.1.2 Retaliatory measures
- 3.2.2 Impact on the industry
- 3.2.2.1 Supply-side impact
- 3.2.2.1.1 Price volatility in key raw material
- 3.2.2.1.2 Supply chain restructuring
- 3.2.2.1.3 Production cost implications
- 3.2.2.2 Demand-side impact (selling price)
- 3.2.2.2.1 Price transmission to end markets
- 3.2.2.2.2 Market share dynamics
- 3.2.2.2.3 Consumer response patterns
- 3.2.2.1 Supply-side impact
- 3.2.3 key companies impacted
- 3.2.4 strategic industry responses
- 3.2.4.1 Supply chain reconfiguration
- 3.2.4.2 Pricing and product strategies
- 3.2.4.3 Policy engagement
- 3.2.5 Outlook and future considerations
- 3.2.1 Impact on trade
- 3.3 Impact forces
- 3.3.1 Growth drivers
- 3.3.1.1 Rising adoption of solid-state LiDAR in autonomous vehicles
- 3.3.1.2 Growth in PET and SPECT imaging in healthcare diagnostics
- 3.3.1.3 Increased demand for compact, low-power optical sensors
- 3.3.1.4 Expansion of flow cytometry and life science research
- 3.3.1.5 Emergence of 3D imaging in robotics and industrial automation
- 3.3.2 Industry pitfalls & challenges
- 3.3.2.1 High manufacturing cost and price sensitivity
- 3.3.2.2 Thermal instability and noise at high operating temperatures
- 3.3.1 Growth drivers
- 3.4 Growth potential analysis
- 3.5 Technological & innovation landscape
- 3.6 Patent analysis
- 3.7 Key news and initiatives
- 3.8 Future market trends
- 3.9 Porter's analysis
- 3.10 PESTEL analysis
- 3.11 Regulatory landscape
Chapter 4 Competitive Landscape, 2024
- 4.1 Introduction
- 4.2 Company market share analysis
- 4.3 Competitive positioning matrix
- 4.4 Strategic outlook matrix
Chapter 5 Market Estimates & Forecast, By Type, 2021-2034 (USD Million & Units)
- 5.1 Key trends
- 5.2 Analog SiPM
- 5.3 Digital SiPM
Chapter 6 Market Estimates & Forecast, By Spectral Sensitivity, 2021-2034 (USD Million & Units)
- 6.1 Key trends
- 6.2 Near ultraviolet (NUV)
- 6.3 Visible spectrum (RGB)
- 6.4 Near infrared (NIR)
- 6.5 Broad spectrum/multispectral
Chapter 7 Market Estimates & Forecast, By Application, 2021-2034 (USD Million & Units)
- 7.1 LiDAR & 3D ranging
- 7.2 Medical imaging
- 7.3 High-energy physics
- 7.4 Nuclear & radiation detection
- 7.5 Flow cytometry
- 7.6 Others
Chapter 8 Market Estimates & Forecast, By End Use Industry, 2021-2034 (USD Million & Units)
- 8.1 Healthcare & life sciences
- 8.2 Automotive
- 8.3 Aerospace & defense
- 8.4 Industrial
- 8.5 Others
Chapter 9 Market Estimates & Forecast, By Region, 2021-2034 (USD Million & Units)
- 9.1 Key trends
- 9.2 North America
- 9.2.1 U.S.
- 9.2.2 Canada
- 9.3 Europe
- 9.3.1 UK
- 9.3.2 Germany
- 9.3.3 France
- 9.3.4 Italy
- 9.3.5 Spain
- 9.3.6 Russia
- 9.4 Asia Pacific
- 9.4.1 China
- 9.4.2 India
- 9.4.3 Japan
- 9.4.4 South Korea
- 9.4.5 Australia
- 9.5 Latin America
- 9.5.1 Brazil
- 9.5.2 Mexico
- 9.6 MEA
- 9.6.1 South Africa
- 9.6.2 Saudi Arabia
- 9.6.3 UAE
Chapter 10 Company Profiles
- 10.1 AdvanSiD
- 10.2 Berkeley Nucleonics Corporation
- 10.3 Berthold Technologies GmbH & Co.KG
- 10.4 Broadcom
- 10.5 Excelitas Technologies Corp.
- 10.6 First Sensor
- 10.7 Hamamatsu Photonics K.K.
- 10.8 John Caunt Scientific ltd.
- 10.9 Radiation Monitoring Devices
- 10.10 Semiconductor Components Industries, LLC
- 10.11 Thorlabs, Inc.

