
PUBLISHER: Global Market Insights Inc. | PRODUCT CODE: 1755246

PUBLISHER: Global Market Insights Inc. | PRODUCT CODE: 1755246
Enterprise Data Visualization Platform Market Opportunity, Growth Drivers, Industry Trend Analysis, and Forecast 2025 - 2034
The Global Enterprise Data Visualization Platform Market was valued at USD 8.8 billion in 2024 and is estimated to grow at a CAGR of 14.1% to reach USD 27.7 billion by 2034, driven by the acceleration of digital transformation efforts and a rising demand for cloud-based analytics. As organizations increasingly focus on becoming data-centric, there's a notable shift toward tools that enable real-time, actionable insights. Businesses are moving away from static reporting and adopting dynamic platforms that foster agility, collaboration and informed decision-making. The integration of artificial intelligence and machine learning capabilities into visualization tools is further transforming them into engines of predictive insights and anomaly detection. These advancements allow enterprises to respond swiftly to shifting market conditions. Centralized systems now bridge fragmented data sources, improving visibility across departments and facilitating strategic initiatives. With cloud-native tools offering scalable and cost-effective solutions, enterprises are better equipped to adapt to evolving business environments, making data visualization a cornerstone of operational excellence and competitive growth.
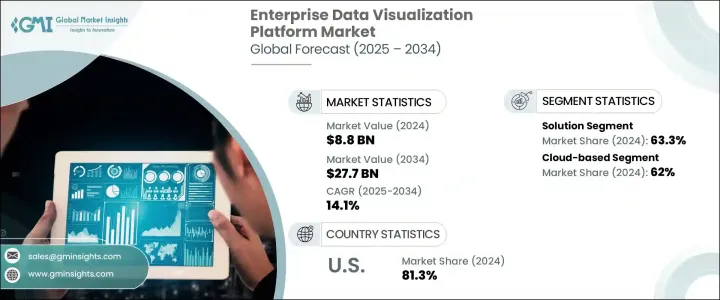
In 2024, cloud-based platforms held 62% share and is forecasted to grow at a CAGR of 14.9% between 2025 and 2034. These platforms offer unmatched flexibility, supporting decentralized teams and dynamic business needs. Their ability to integrate quickly with various systems and provide on-demand insights make them the preferred choice for organizations seeking scalable, real-time analytics. With features like embedded analytics, AI-enhanced exploration, and auto-scaling, they deliver powerful performance without the complexity of traditional infrastructure.
| Market Scope | |
|---|---|
| Start Year | 2024 |
| Forecast Year | 2025-2034 |
| Start Value | $8.8 Billion |
| Forecast Value | $27.7 Billion |
| CAGR | 14.1% |
The solution segment held 63.3% share and will grow at 15% CAGR through 2034. These platforms blend deep analytics functionality with intuitive design, enabling users to drive both strategic and operational decisions. Often deployed in digital transformation projects, these solutions allow enterprises to streamline reporting, monitor operations, and gain customer insights using interactive models and pre-built templates. Low-code and no-code features enable broader user adoption, helping teams across departments create their dashboards, reduce IT dependency, and foster a data-first culture.
North America Enterprise Data Visualization Platform Market held 81.3% share and generated USD 10.5 billion in 2024. The market's growth is supported by a highly digitized ecosystem, widespread use of intelligence tools, and a strong presence of technology innovators. Companies continue to invest in advanced analytics and cloud platforms to drive operational agility and strategic alignment. The mature infrastructure and abundant data talent make it a prime hub for developing and deploying cutting-edge visualization technologies.
Key players driving innovation in the Global Enterprise Data Visualization Platform Market include Salesforce, MicroStrategy, Qlik, Amazon Web Services (AWS), Google, IBM Corporation, SAP SE, Microsoft Corporation, Domo, and Oracle Corporation. Leading companies in the enterprise data visualization platform market focus on innovation, cloud expansion, and AI integration to solidify their market position. Many are enhancing their platforms with AI-driven features such as predictive analytics, natural language processing, and automated anomaly detection to improve user experience and decision-making capabilities. Vendors are investing in cloud-native architectures and embedded analytics. Organizations prioritize ease of use by offering low-code customization and intuitive interfaces, enabling broader adoption across business units.
Table of Contents
Chapter 1 Methodology & Scope
- 1.1 Research design
- 1.1.1 Research approach
- 1.1.2 Data collection methods
- 1.2 Base estimates and calculations
- 1.2.1 Base year calculation
- 1.2.2 Key trends for market estimates
- 1.3 Forecast model
- 1.4 Primary research & validation
- 1.4.1 Primary sources
- 1.4.2 Data mining sources
- 1.5 Market definitions
Chapter 2 Executive Summary
- 2.1 Industry 3600 synopsis, 2021 - 2034
Chapter 3 Industry Insights
- 3.1 Industry ecosystem analysis
- 3.2 Supplier landscape
- 3.2.1 Technology providers
- 3.2.2 System integrators
- 3.2.3 Cloud and infrastructure providers
- 3.2.4 End use
- 3.3 Impact of Trump administration tariffs
- 3.3.1 Trade impact
- 3.3.1.1 Trade volume disruptions
- 3.3.1.2 Retaliatory measures
- 3.3.2 Impact on industry
- 3.3.2.1 Supply-side impact (raw materials)
- 3.3.2.1.1 Price volatility in key materials
- 3.3.2.1.2 Supply chain restructuring
- 3.3.2.1.3 Production cost implications
- 3.3.2.2 Demand-side impact (Cost to customers)
- 3.3.2.2.1 Price transmission to end markets
- 3.3.2.2.2 Market share dynamics
- 3.3.2.2.3 Consumer response patterns
- 3.3.2.1 Supply-side impact (raw materials)
- 3.3.3 Key companies impacted
- 3.3.4 Strategic industry responses
- 3.3.4.1 Supply chain reconfiguration
- 3.3.4.2 Pricing and product strategies
- 3.3.4.3 Policy engagement
- 3.3.5 Outlook & future considerations
- 3.3.1 Trade impact
- 3.4 Profit margin analysis
- 3.5 Technology & innovation landscape
- 3.6 Patent analysis
- 3.7 Use cases
- 3.8 Key news & initiatives
- 3.9 Regulatory landscape
- 3.10 Impact forces
- 3.10.1 Growth drivers
- 3.10.1.1 Rapid digital transformation
- 3.10.1.2 Integration of AI and machine learning in business processes
- 3.10.1.3 Growing adoption of Robotic Process Automation (RPA)
- 3.10.1.4 Cloud adoption and SaaS expansion
- 3.10.2 Industry pitfalls & challenges
- 3.10.2.1 High implementation costs
- 3.10.2.2 Data privacy and security concerns
- 3.10.1 Growth drivers
- 3.11 Growth potential analysis
- 3.12 Porter's analysis
- 3.13 PESTEL analysis
Chapter 4 Competitive Landscape, 2024
- 4.1 Introduction
- 4.2 Company market share analysis
- 4.3 Competitive positioning matrix
- 4.4 Strategic outlook matrix
Chapter 5 Market Estimates & Forecast, By Component, 2021 - 2034 ($Mn)
- 5.1 Key trends
- 5.2 Solution
- 5.3 Services
- 5.3.1 Professional services
- 5.3.2 Managed services
Chapter 6 Market Estimates & Forecast, By Deployment Model, 2021 - 2034 ($Mn)
- 6.1 Key trends
- 6.2 Cloud-based
- 6.3 On-premises
Chapter 7 Market Estimates & Forecast, By Organization Size, 2021 - 2034 ($Mn)
- 7.1 Key trends
- 7.2 Large Enterprise
- 7.3 SME
Chapter 8 Market Estimates & Forecast, By Application, 2021 - 2034 ($Mn)
- 8.1 Key trends
- 8.2 Business intelligence
- 8.3 Performance monitoring
- 8.4 Risk and compliance
- 8.5 Sales and marketing analytics
- 8.6 Operations management
Chapter 9 Market Estimates & Forecast, By End Use, 2021 - 2034 ($Mn)
- 9.1 Key trends
- 9.2 BFSI
- 9.3 Healthcare
- 9.4 Retail
- 9.5 IT & telecom
- 9.6 Education
- 9.7 Manufacturing
- 9.8 Transportation & logistics
- 9.9 Others
Chapter 10 Market Estimates & Forecast, By Region, 2021 - 2034 ($Mn)
- 10.1 Key trends
- 10.2 North America
- 10.2.1 U.S.
- 10.2.2 Canada
- 10.3 Europe
- 10.3.1 UK
- 10.3.2 Germany
- 10.3.3 France
- 10.3.4 Italy
- 10.3.5 Spain
- 10.3.6 Russia
- 10.3.7 Nordics
- 10.4 Asia Pacific
- 10.4.1 China
- 10.4.2 India
- 10.4.3 Japan
- 10.4.4 South Korea
- 10.4.5 ANZ
- 10.4.6 Southeast Asia
- 10.5 Latin America
- 10.5.1 Brazil
- 10.5.2 Mexico
- 10.5.3 Argentina
- 10.6 MEA
- 10.6.1 UAE
- 10.6.2 Saudi Arabia
- 10.6.3 South Africa
Chapter 11 Company Profiles
- 11.1 Amazon Web Services (AWS)
- 11.2 Alteryx
- 11.3 Board International
- 11.4 Domo
- 11.5 Dundas BI
- 11.6 Google
- 11.7 IBM Corporation
- 11.8 InetSoft Technology
- 11.9 Infor Birst
- 11.10 Microsoft Corporation
- 11.11 MicroStrategy
- 11.12 Oracle Corporation
- 11.13 Qlik
- 11.14 Salesforce
- 11.15 SAP SE
- 11.16 Sisense
- 11.17 ThoughtSpot
- 11.18 TIBCO Software
- 11.19 Yellowfin
- 11.20 Zoho Analytics

