
PUBLISHER: Global Market Insights Inc. | PRODUCT CODE: 1755257

PUBLISHER: Global Market Insights Inc. | PRODUCT CODE: 1755257
Partially Hydrolyzed Guar Gum Market Opportunity, Growth Drivers, Industry Trend Analysis, and Forecast 2025 - 2034
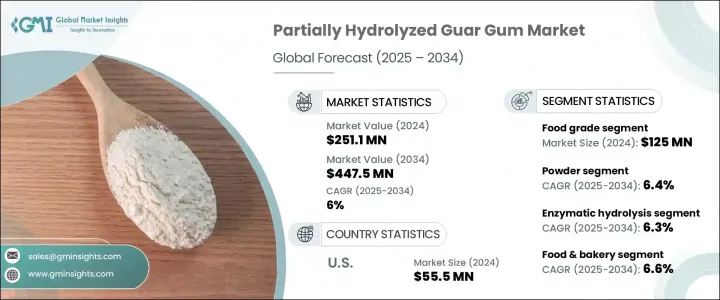
The Global Partially Hydrolyzed Guar Gum Market was valued at USD 251.1 million in 2024 and is estimated to grow at a CAGR of 6% to reach USD 447.5 million by 2034, driven by the global surge in demand for digestive health products, clean-label nutrition, and prebiotic-enriched foods. PHGG undergoes enzymatic hydrolysis, making it a low-viscosity, water-soluble fiber ideal for several applications. It maintains stability across varying pH levels and temperatures, offering compatibility with diverse food systems including functional foods, beverages, and dietary supplements. The increasing shift toward plant-based, allergen-free ingredients has also positioned PHGG as a preferred component in formulating health-focused consumer products.
Consumers seeking digestive relief are fueling the demand for PHGG in nutraceuticals, where its prebiotic benefits support gut microbiota balance and alleviate symptoms of gastrointestinal disorders. The ingredients are increasingly found in bakery goods, plant-based alternatives, fortified snacks, and therapeutic formulations due to ease of incorporation and functional versatility. It offers clean-label appeal, excellent solubility, and a mild taste, making it ideal for health-conscious consumers looking to boost daily fiber intake without compromising texture or flavor.
| Market Scope | |
|---|---|
| Start Year | 2024 |
| Forecast Year | 2025-2034 |
| Start Value | $251.1 Million |
| Forecast Value | $447.5 Million |
| CAGR | 6% |
The food-grade segment generated USD 125 million in 2024. This segment benefits from the broad usage of PHGG in everyday food items due to its solubility and health-promoting qualities. PHGG's ability to deliver functional fiber without compromising flavor or texture has driven its integration into fiber-enriched beverages, cereals, and meal bars. Its role in promoting satiety and digestive comfort makes it ideal for consumers seeking clean-label, wellness-oriented products.
The pharmaceutical segment generated USD 70.9 million in 2024 and is projected to reach USD 116.4 million by 2034. PHGG is well-recognized in clinical nutrition for managing digestive ailments such as IBS and constipation. Its low viscosity and tolerance across age groups make it suitable for long-term dietary support. As clinical data increasingly affirms its efficacy, PHGG is finding wider use in colon health supplements and therapeutic fiber-based interventions, especially in geriatric and health-conscious populations worldwide.
United States Partially Hydrolyzed Guar Gum Market generated USD 55.5 million in 2024 witnessing substantial traction from the food and pharma sectors. Use cases are expanding rapidly across therapeutic dietary applications, medical nutrition, and even pet and personal care categories, with demand rising especially among aging populations. The ingredient's ability to support digestive health, manage glycemic response, and aid in weight control positions are a functional staple in health-focused product development. Formulators are also exploring PHGG for its compatibility with supplements, clinical nutrition formulas, and geriatric dietary needs.
Key market players in the Partially Hydrolyzed Guar Gum Market include BASF SE, Ingredion Incorporated (and its subsidiary Tic Gums, Inc.), CP Kelco U.S., Inc., Ashland Global Holdings Inc., and Cargill, Incorporated. These companies are actively contributing to market innovation and expansion. Strategic focus, leading companies in the partially hydrolyzed guar gum space are investing heavily in R&D to develop specialized PHGG variants tailored for pharmaceutical, functional food, and clean-label applications. Many players are expanding their production capacities to meet growing global demand, especially in North America and Asia. Strategic collaborations with food and nutraceutical manufacturers are helping firms broaden their distribution networks. Regulatory approvals and clinical validation are also key to market entry and credibility, prompting companies to prioritize scientific studies and safety certifications.
Table of Contents
Chapter 1 Methodology and Scope
- 1.1 Research methodology
- 1.2 Research scope & assumptions
- 1.3 List of data sources
- 1.4 Market estimation technique
- 1.5 Market segmentation & breakdown
- 1.6 Research limitations
Chapter 2 Executive Summary
- 2.1 Market snapshot
- 2.2 Segment highlights
- 2.3 Competitive landscape snapshot
- 2.4 Regional market outlook
- 2.5 Key market trends
- 2.6 Future market outlook
Chapter 3 Industry Insights
- 3.1 Market introduction
- 3.2 Industry value chain analysis
- 3.3 Product overview
- 3.3.1 Phgg: definition & composition
- 3.3.2 Production process & enzymatic hydrolysis
- 3.3.3 Physicochemical properties
- 3.3.4 Nutritional profile & health benefits
- 3.3.5 Prebiotic properties & gut health effects
- 3.3.6 Comparison with native guar gum
- 3.3.7 Comparison with other dietary fibers
- 3.4 Market dynamics
- 3.4.1 Market drivers
- 3.4.1.1 Rising demand for digestive health and prebiotics
- 3.4.1.2 Growth in functional foods and nutraceuticals
- 3.4.1.3 Clean-label and plant-based ingredient preferences
- 3.4.1 Market drivers
- 3.5 Market restraints
- 3.5.1.1 High production and processing costs
- 3.5.1.2 Limited consumer awareness in emerging markets
- 3.5.1.3 Regulatory complexity across regions
- 3.6 Market opportunities
- 3.6.1.1 Rising demand for gut health functional ingredients
- 3.6.1.2 Expanding applications in nutraceutical and food sectors
- 3.6.1.3 Growing interest in low-fodmap dietary fibers
- 3.7 Industry impact forces
- 3.7.1 Growth potential analysis
- 3.7.2 Industry pitfalls & challenges
- 3.8 Regulatory framework & standards
- 3.8.1 Food additive regulations
- 3.8.2 Dietary fiber definitions
- 3.8.3 Health claim regulations
- 3.8.4 Quality & safety standards
- 3.8.5 Organic & non-gmo certifications
- 3.9 Manufacturing process analysis
- 3.9.1 Guar gum extraction
- 3.9.2 Enzymatic hydrolysis process
- 3.9.3 Purification techniques
- 3.9.4 Drying & milling
- 3.9.5 Quality control procedures
- 3.10 Raw material analysis & procurement strategies
- 3.11 Pricing analysis
- 3.12 Sustainability & environmental impact assessment
- 3.13 Pestle analysis
- 3.14 Porter's five forces analysis
- 3.15 Trade analysis: import-export scenario
- 3.16 Trump administration tariff analysis
- 3.16.1 Impact on trade
- 3.16.1.1 Trade volume disruptions
- 3.16.1.2 Retaliatory measures
- 3.16.2 Impact on the industry
- 3.16.2.1 Supply-side impact (raw materials)
- 3.16.2.1.1 Price volatility in key materials
- 3.16.2.1.2 Supply chain restructuring
- 3.16.2.1.3 Production cost implications
- 3.16.2.2 Demand-side impact (selling price)
- 3.16.2.2.1 Price transmission to end markets
- 3.16.2.2.2 Market share dynamics
- 3.16.2.2.3 Consumer response patterns
- 3.16.2.3 Key companies impacted
- 3.16.2.4 Strategic industry responses
- 3.16.2.5 Supply chain reconfiguration
- 3.16.2.6 Pricing and product strategies
- 3.16.2.7 Policy engagement
- 3.16.2.8 Trade statistics (hs code)
- 3.16.2.8.1 Major exporting countries, 2021-2024 (USD BN)
- 3.16.2.8.1.1 U.S.
- 3.16.2.8.1.2 Japan
- 3.16.2.8.1.3 South Korea
- 3.16.2.8.2 Major importing countries, 2021-2024 (USD BN)
- 3.16.2.8.2.1 India
- 3.16.2.8.2.2 Russia
- 3.16.2.8.2.3 U.S.
- 3.16.2.8.1 Major exporting countries, 2021-2024 (USD BN)
- 3.16.2.1 Supply-side impact (raw materials)
- 3.16.1 Impact on trade
Note: the above trade statistics will be provided for key countries only.
Chapter 4 Competitive Landscape, 2024
- 4.1 Market share analysis
- 4.2 Strategic framework
- 4.2.1 Mergers & acquisitions
- 4.2.2 Joint ventures & collaborations
- 4.2.3 New product developments
- 4.2.4 Expansion strategies
- 4.3 Competitive benchmarking
- 4.4 Vendor landscape
- 4.5 Competitive positioning matrix
- 4.6 Strategic dashboard
- 4.7 Patent analysis & innovation assessment
- 4.8 Market entry strategies for new players
- 4.9 Distribution network analysis
Chapter 5 Market Estimates and Forecast, By Grade, 2021 - 2034 (USD Million) (Kilo Tons)
- 5.1 Key trends
- 5.2 Food grade
- 5.2.1 Standard
- 5.2.2 Premium
- 5.3 Pharmaceutical
- 5.4 Industrial
- 5.5 Other
Chapter 6 Market Estimates and Forecast, By Form 2021 - 2034 (USD Million) (Kilo Tons)
- 6.1 Key trends
- 6.2 Powder
- 6.2.1 Fine
- 6.2.2 Coarse
- 6.3 Granules
- 6.4 Others
Chapter 7 Market Estimates and Forecast, By Production Method, 2021 - 2034 (USD Million) (Kilo Tons)
- 7.1 Key trends
- 7.2 Enzymatic hydrolysis
- 7.2.1 Batch
- 7.2.2 Continuous
- 7.3 Chemical hydrolysis
- 7.4 Other production
Chapter 8 Market Estimates and Forecast, By Application 2021 - 2034 (USD Million) (Kilo Tons)
- 8.1 Key trends
- 8.2 Food & bakery
- 8.2.1 Bakery & confectionery
- 8.2.2 Dairy & frozen desserts
- 8.2.3 Beverages
- 8.2.4 Breakfast cereals & bars
- 8.2.5 Sauces, dressings and condiments
- 8.2.6 Meat & poultry product
- 8.2.7 Other food applications
- 8.3 Dietery supplement
- 8.3.1 Fiber supplements
- 8.3.2 Weight management supplements
- 8.3.3 Digestive health supplements
- 8.3.4 Other supplement types
- 8.4 Pharmaceuticals
- 8.4.1 Solid dosage forms
- 8.4.2 Liquid formulations
- 8.4.3 Other pharmaceuticals application
- 8.5 Personal care & cosmetics
- 8.6 Animal feed
- 8.7 Other applications
Chapter 9 Market Estimates and Forecast, By Functionality, 2021 - 2034 (USD Million) (Kilo Tons)
- 9.1 Key trends
- 9.2 Dietary fiber enrichment
- 9.3 Prebiotic effect
- 9.4 Texture modification
- 9.5 Stabilization
- 9.6 Thickening
- 9.7 Fat replacement
- 9.8 Other functionalities
Chapter 10 Market Estimates and Forecast, By End Use, 2021 - 2034 (USD Million) (Kilo Tons)
- 10.1 Key trends
- 10.2 Food & beverage industry
- 10.2.1 Large food manufacturers
- 10.2.2 Medium & small food processors
- 10.2.3 Specialty food producers
- 10.3 Nutraceutical industry
- 10.4 Pharmaceutical industry
- 10.4.1 Large pharmaceutical companies
- 10.4.2 Generic drug manufacturers
- 10.4.3 Contract manufacturing organizations (cmos)
- 10.5 Personal care industry
- 10.6 Animal feed industry
- 10.7 Other end-use industries
Chapter 11 Market Estimates and Forecast, By Distribution Channel, 2021 - 2034 (USD Million) (Kilo Tons)
- 11.1 Key trends
- 11.2 Direct sales
- 11.3 Distributors & wholesalers
- 11.4 Online channels
- 11.5 Others
Chapter 12 Market Estimates and Forecast, By Region, 2021 - 2034 (USD Million) (Kilo Tons)
- 12.1 Key trends
- 12.2 North America
- 12.2.1 U.S.
- 12.2.2 Canada
- 12.3 Europe
- 12.3.1 Germany
- 12.3.2 UK
- 12.3.3 France
- 12.3.4 Spain
- 12.3.5 Italy
- 12.3.6 Russia
- 12.3.7 Rest of Europe
- 12.4 Asia Pacific
- 12.4.1 China
- 12.4.2 India
- 12.4.3 Japan
- 12.4.4 Australia
- 12.4.5 South Korea
- 12.4.6 Rest of Asia Pacific
- 12.5 Latin America
- 12.5.1 Brazil
- 12.5.2 Mexico
- 12.5.3 Argentina
- 12.5.4 Rest of Latin America
- 12.6 Middle East and Africa
- 12.6.1 Saudi Arabia
- 12.6.2 South Africa
- 12.6.3 UAE
- 12.6.4 Rest of MEA
Chapter 13 Company Profiles
- 13.1 Altrafine Gums
- 13.2 Ashland Global Holdings Inc.
- 13.3 BASF SE
- 13.4 Cargill, Incorporated
- 13.5 CP Kelco U.S., Inc.
- 13.6 Dabur India Ltd.
- 13.7 Deosen Biochemical Ltd.
- 13.8 DuPont de Nemours, Inc.
- 13.9 Fufeng Group
- 13.10 Guangrao Liuhe Chemical Co., Ltd.
- 13.11 Hindustan Gum & Chemicals Ltd.
- 13.12 Ingredion Incorporated
- 13.13 Jingkun Chemistry Company
- 13.14 Kerry Group plc
- 13.15 Lonza Group AG
- 13.16 Lotus Gums & Chemicals
- 13.17 Lucid Colloids Ltd.
- 13.18 Meihua Holdings Group Co., Ltd.
- 13.19 Neelkanth Polymers
- 13.20 Nexira
- 13.21 Polygal AG
- 13.22 Rama Industries
- 13.23 Shandong Yuansheng Chemical Co., Ltd.
- 13.24 Shree Ram Gum Chemicals
- 13.25 Sunita Hydrocolloids Pvt. Ltd.
- 13.26 Taiyo International, Inc.
- 13.27 Tic Gums, Inc. (Ingredion)
- 13.28 Vikas WSP Limited
- 13.29 Wuxi Jinxin Science & Technology Co., Ltd.

