
PUBLISHER: Global Market Insights Inc. | PRODUCT CODE: 1755304

PUBLISHER: Global Market Insights Inc. | PRODUCT CODE: 1755304
Autonomous Vehicle Simulation Solutions Market Opportunity, Growth Drivers, Industry Trend Analysis, and Forecast 2025 - 2034
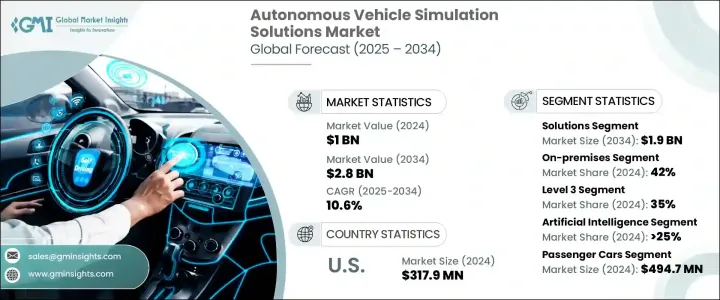
The Global Autonomous Vehicle Simulation Solutions Market was valued at USD 1 billion in 2024 and is estimated to grow at a CAGR of 10.6% to reach USD 2.8 billion by 2034. This market plays a pivotal role in supporting the evolution, evaluation, and deployment of autonomous driving systems. Simulation platforms are now an essential part of the development process, allowing automotive manufacturers and technology providers to test and validate complex automated driving functions in controlled and repeatable virtual environments. These platforms replicate real-world driving scenarios, enabling engineers to identify and resolve critical challenges long before vehicles hit the road. As autonomous systems become increasingly advanced and nuanced, simulation tools are needed across all phases of design, development, and safety validation.
In a world where road safety remains a major concern, simulation technologies are seen as a practical solution to reduce the staggering toll of traffic-related injuries and fatalities. Traditional testing methods are often time-consuming, expensive, and risky, especially when recreating dangerous or uncommon scenarios. Simulations bridge this gap by offering a cost-effective and scalable alternative to physical testing, where thousands of edge cases can be analyzed without endangering human life. With human error accounting for the majority of traffic incidents, there is a growing urgency to develop automated systems that can operate more safely and predictably than human drivers. Simulation-based tools make it possible to test these systems under an infinite variety of conditions, including those that are too hazardous or rare to replicate in the real world.
| Market Scope | |
|---|---|
| Start Year | 2024 |
| Forecast Year | 2025-2034 |
| Start Value | $1 Billion |
| Forecast Value | $2.8 Billion |
| CAGR | 10.6% |
As artificial intelligence, machine learning, and high-performance computing technologies continue to progress, simulation platforms have become more advanced, accurate, and scalable. Today's solutions go far beyond basic environmental modeling; they enable real-time, driver-in-the-loop testing and cloud-powered simulations that support the full lifecycle of autonomous vehicle development. From generating complex scenarios to validating decision-making algorithms, these tools are transforming how the industry builds and tests safe autonomous systems.
By component, the market is segmented into solutions and services. In 2024, the solutions segment accounted for 68% of the global market and is expected to generate USD 1.9 billion in revenue by 2034. The demand for advanced software in this segment is growing rapidly, primarily due to its ability to offer dynamic virtual environments. These software platforms allow engineers to simulate everything from traffic scenarios to system responses under various environmental conditions. Developers use these tools to replicate real-world challenges, optimize system performance, and ensure regulatory compliance without physical risks or limitations.
Deployment-wise, the market is divided into on-premises, cloud-based, and hybrid models. On-premises solutions dominated the segment with a 42% market share in 2024. Companies requiring high data confidentiality, low-latency computing, and full control over simulation parameters prefer these setups. This is especially true for firms conducting real-time simulations or testing sensitive, proprietary technologies.
In terms of autonomy level, the market includes level 1 through more than level 5 classifications. The level 3 segment-conditional automation-held 35% of the market in 2024. This level requires the vehicle to handle most driving functions under specific conditions but still relies on human intervention when prompted. As level 3 systems introduce more complex transition scenarios between manual and automated control, simulation plays a critical role in testing these life-cycle transitions to ensure safe handoffs between systems. The services segment supporting these systems is expected to expand at a CAGR of around 9.5% over the forecast period.
By technology, the market covers Artificial Intelligence, Machine Learning, AR/VR, Big Data Analytics, and others. The Artificial Intelligence segment led the market with over 25% share in 2024. AI enhances simulation environments by enabling intelligent scenario generation and predictive modeling. It makes simulations more responsive, realistic, and capable of representing complex interactions among vehicles, pedestrians, and the environment. AI also helps scale simulations efficiently, allowing developers to train and validate systems on a wider range of conditions.
Based on vehicle type, the market is categorized into passenger cars, commercial vehicles, and two-wheelers & delivery bots. The passenger cars segment was the largest in 2024, generating USD 494.7 million. With the rising integration of semi-autonomous features in consumer vehicles, simulation solutions are essential for validating driver-assistance functions like adaptive cruise control, lane keeping, and autonomous parking. These solutions help manufacturers ensure the reliability and safety of these systems before real-world deployment.
Regionally, the U.S. led the North American market with revenue of USD 317.9 million in 2024. This growth is fueled by a robust ecosystem of innovation and favorable policies supporting autonomous vehicle testing and deployment. Leading domestic companies are actively investing in simulation technologies to accelerate their development timelines and reduce risks associated with physical testing. Regulatory frameworks in the U.S. also promote simulation-based validation, positioning the country as a front-runner in the global landscape.
Key market players are pursuing strategic initiatives such as partnerships, mergers, acquisitions, and R&D investments to enhance their simulation capabilities. These efforts are focused on developing cutting-edge platforms that combine AI, machine learning, and digital twin technologies to improve test coverage, scalability, and accuracy. Companies are also working closely with OEMs and regulatory bodies to align their solutions with evolving industry standards and accelerate the commercialization of autonomous vehicles.
Table of Contents
Chapter 1 Methodology & Scope
- 1.1 Research design
- 1.1.1 Research approach
- 1.1.2 Data collection methods
- 1.2 Base estimates & calculations
- 1.2.1 Base year calculation
- 1.2.2 Key trends for market estimation
- 1.3 Forecast model.
- 1.4 Primary research and validation
- 1.4.1 Primary sources
- 1.4.2 Data mining sources
- 1.5 Market scope & definition
Chapter 2 Executive Summary
- 2.1 Industry synopsis, 2021 – 2034
- 2.2 Key market trends
- 2.2.1 Regional
- 2.2.2 Component
- 2.2.3 Autonomy level
- 2.2.4 Technology
- 2.2.5 Vehicle
- 2.2.6 Deployment
- 2.2.7 Application
- 2.2.8 End use
- 2.3 TAM Analysis, 2025-2034
- 2.4 CXO perspectives: Strategic imperatives
- 2.4.1 Key decision points for industry executives
- 2.4.2 Critical success factors for market players
- 2.5 Future Outlook and Strategic Recommendations
Chapter 3 Industry Insights
- 3.1 Industry ecosystem analysis
- 3.1.1 Supplier landscape
- 3.1.1.1 Cloud platform providers
- 3.1.1.2 Scenario generation & management service providers
- 3.1.1.3 Hardware-in-the-loop (HiL) & software-in-the-loop (SiL) testing providers
- 3.1.1.4 Digital twin & virtual vehicle service providers
- 3.1.1.5 Validation & safety compliance service providers
- 3.1.2 Profit Margin
- 3.1.3 Cost structure
- 3.1.4 Value addition at each stage
- 3.1.5 Factor affecting the value chain
- 3.1.6 Disruptions
- 3.1.1 Supplier landscape
- 3.2 Technology & innovation landscape
- 3.2.1 Current technological trends
- 3.2.1.1 AI-driven scenario generation and testing
- 3.2.1.2 Real-time sensor fusion simulation
- 3.2.1.3 Cloud-based simulation and scalability
- 3.2.1.4 Digital twin and virtual prototyping
- 3.2.2 Emerging Technologies
- 3.2.2.1 Physics-based and data-driven hybrid simulation models
- 3.2.2.2 Edge AI for in-vehicle real-time validation
- 3.2.2.3 Synthetic data generation using generative AI
- 3.2.2.4 Blockchain for data integrity and simulation traceability
- 3.2.3 Advanced material sciences
- 3.2.1 Current technological trends
- 3.3 Pricing trend
- 3.4 Use cases
- 3.5 Best-case scenario
- 3.6 Key news & initiatives
- 3.7 Regulatory landscape
- 3.7.1 North America
- 3.7.2 Europe
- 3.7.3 Asia Pacific
- 3.7.4 Latin America
- 3.7.5 Middle East & Africa
- 3.8 Impact on forces
- 3.8.1 Growth drivers
- 3.8.1.1 Advancements in AI and machine learning algorithms
- 3.8.1.2 Growing complexity of ADAS and autonomous systems
- 3.8.1.3 Need for high-fidelity sensor modeling and environmental realism
- 3.8.1.4 Scalability and cost-effectiveness of virtual testing
- 3.8.2 Industry pitfalls & challenges
- 3.8.2.1 Challenges in replicating real-world complexity and edge cases
- 3.8.2.2 High computational requirements for high-fidelity simulations
- 3.8.3 Market opportunity
- 3.8.1 Growth drivers
- 3.9 Growth potential analysis
- 3.10 Porter's analysis
- 3.11 PESTEL analysis
- 3.12 Sustainability and environmental aspects
- 3.12.1 Sustainable practices
- 3.12.2 Energy efficiency in production
- 3.12.3 Eco-friendly initiatives
Chapter 4 Competitive Landscape, 2024
- 4.1 Introduction
- 4.2 Company market share analysis
- 4.2.1 North America
- 4.2.2 Europe
- 4.2.3 Asia Pacific
- 4.2.4 LATAM
- 4.2.5 MEA
- 4.3 Competitive positioning matrix
- 4.4 Strategic outlook matrix
- 4.5 Key developments
- 4.5.1 Mergers & acquisitions
- 4.5.2 Partnerships & collaborations
- 4.5.3 New product launches
- 4.5.4 Expansion plans and funding
Chapter 5 Market Estimates & Forecast, By Component, 2021 - 2034 ($Bn)
- 5.1 Key trends
- 5.2 Software
- 5.2.1 Scenario generation tools
- 5.2.2 Sensor simulation software
- 5.2.3 3D modeling and visualization
- 5.2.4 Physics-based simulators
- 5.2.5 AI & ML simulation platforms
- 5.3 Services
- 5.3.1 Consulting & integration services
- 5.3.2 Support & maintenance
- 5.3.3 Simulation-as-a-Service (SaaS)
Chapter 6 Market Estimates & Forecast, By Autonomy level, 2021 - 2034 ($Bn)
- 6.1 Key trends
- 6.2 Level 1
- 6.3 Level 2
- 6.4 Level 3
- 6.5 Level 4
- 6.6 Level 5 and above
Chapter 7 Market Estimates & Forecast, By Technology, 2021 - 2034 ($Bn)
- 7.1 Key trends
- 7.2 Artificial intelligence
- 7.3 Machine learning
- 7.4 Augmented reality / virtual reality (AR/VR)
- 7.5 Big data analytics
- 7.6 Others
Chapter 8 Market Estimates & Forecast, By Vehicle, 2021 - 2034 ($Bn)
- 8.1 Key trends
- 8.2 Passenger cars
- 8.2.1 Sadan
- 8.2.2 Hatchback
- 8.2.3 SUV
- 8.3 Commercial vehicles
- 8.3.1 Light commercial vehicle
- 8.3.2 Heavy commercial vehicle
- 8.3.3 Buses & coaches
- 8.4 Two-wheelers & delivery bots
Chapter 9 Market Estimates & Forecast, By Deployment, 2021 - 2034 ($Bn)
- 9.1 Key trends
- 9.2 On-premises
- 9.3 Cloud-based
- 9.4 Hybrid
Chapter 10 Market Estimates & Forecast, By Application, 2021 - 2034 ($Bn)
- 10.1 Key trends
- 10.2 Testing & validation
- 10.3 Training & education
- 10.4 System integration
- 10.5 Data annotation & labeling
- 10.6 Performance optimization
Chapter 11 Market Estimates & Forecast, By End Use, 2021 - 2034 ($Bn)
- 11.1 Key trends
- 11.2 Automotive OEMs
- 11.3 Tier 1 & tier 2 suppliers
- 11.4 Tech companies
- 11.5 Government & regulatory bodies
Chapter 12 Market Estimates & Forecast, By Region, 2021 - 2034 ($Bn)
- 12.1 North America
- 12.1.1 U.S.
- 12.1.2 Canada
- 12.2 Europe
- 12.2.1 UK
- 12.2.2 Germany
- 12.2.3 France
- 12.2.4 Italy
- 12.2.5 Spain
- 12.2.6 Belgium
- 12.2.7 Sweden
- 12.3 Asia Pacific
- 12.3.1 China
- 12.3.2 India
- 12.3.3 Japan
- 12.3.4 Australia
- 12.3.5 Singapore
- 12.3.6 South Korea
- 12.3.7 Southeast Asia
- 12.4 Latin America
- 12.4.1 Brazil
- 12.4.2 Mexico
- 12.4.3 Argentina
- 12.5 MEA
- 12.5.1 South Africa
- 12.5.2 Saudi Arabia
- 12.5.3 UAE
Chapter 13 Company Profiles
- 13.1 aiMotive
- 13.2 Altair
- 13.3 Ansys
- 13.4 Applied Intuition
- 13.5 Aptiv
- 13.6 AVL List
- 13.7 Cambridge Systematics
- 13.8 Cognata
- 13.9 Dassault
- 13.10 dSPACE
- 13.11 Foretellix
- 13.12 Green Hills
- 13.13 Hexagon
- 13.14 IPG Automotive
- 13.15 LG
- 13.16 LHP Engineering
- 13.17 MathWorks
- 13.18 Mechanical Simulation
- 13.19 rFpro
- 13.20 Siemens
- 13.21 Synopsys

