
PUBLISHER: Global Market Insights Inc. | PRODUCT CODE: 1755366

PUBLISHER: Global Market Insights Inc. | PRODUCT CODE: 1755366
Beverage Flavoring System Market Opportunity, Growth Drivers, Industry Trend Analysis, and Forecast 2025 - 2034
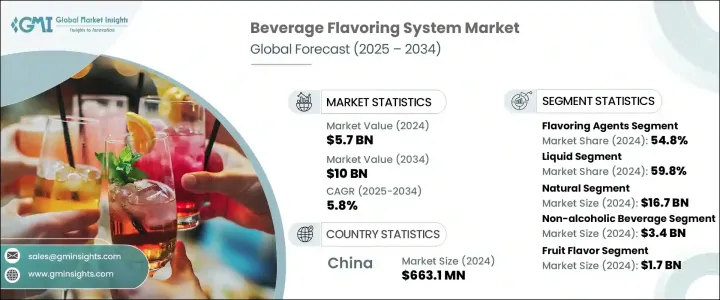
The Global Beverage Flavoring System Market was valued at USD 5.7 billion in 2024 and is estimated to grow at a CAGR of 5.8% to reach USD 10 billion by 2034. This market is undergoing a dynamic transformation fueled by evolving consumer preferences, innovative technologies, and the increasing diversity of beverage applications. As beverage producers strive to enhance product appeal and differentiate offerings, flavor systems have emerged as a critical component in delivering consistent taste, aroma, and visual impact. Every category within the beverage sector-whether it's soft drinks, functional beverages, or dairy-based drinks-relies heavily on tailored flavoring systems to meet market demands.
There is an ongoing shift towards natural and clean-label flavoring solutions, reflecting broader consumer awareness around health and wellness. The rising preference for plant-based, non-GMO, and organically sourced flavor ingredients is encouraging manufacturers to adopt natural components like botanical infusions, essential oils, and fermentation-derived flavors. These elements not only align with current health trends but also support clearer labeling, which further resonates with today's informed consumers. The beverage flavoring system market is driven by constant innovation, increased R&D activity, and heightened competition among global flavor houses. These players are forming strategic collaborations with beverage brands and leveraging new formulation technologies to create unique flavor profiles that stand out in a crowded marketplace.
| Market Scope | |
|---|---|
| Start Year | 2024 |
| Forecast Year | 2025-2034 |
| Start Value | $5.7 Billion |
| Forecast Value | $10 Billion |
| CAGR | 5.8% |
By ingredient type, flavoring agents led the segment with a commanding 54.8% market share in 2024 and are projected to grow at a CAGR of 5.7% through 2034. Their stronghold in the industry stems from their essential role in shaping the sensory characteristics of beverages. These agents are integral to delivering signature taste experiences, meeting consumer demand for authenticity, and elevating product identity. As the appetite for novel and natural taste options continues to grow, flavoring agents are seeing widespread application across both conventional and emerging beverage formats.
In terms of form, liquid forms accounted for the largest share at 59.8% in 2024 and are anticipated to maintain momentum with a 5.7% CAGR. The success of liquid flavor systems is largely due to their ease of integration, uniform distribution in formulations, and cost-effectiveness. Their adaptability allows manufacturers to respond quickly to changing flavor trends, streamline production processes, and reduce operational costs. Whether it's large-scale manufacturing or small-batch production, liquid flavor systems offer unmatched consistency and processing efficiency.
When segmented by origin, the natural flavor segment stood out with a significant valuation of USD 16.7 billion in 2024. This dominance reflects the increasing popularity of health-forward, clean-label beverages. As consumers grow more cautious about synthetic ingredients, natural flavors have gained favor for their transparency, authenticity, and perceived health benefits. Beverage producers are reformulating products to emphasize natural claims, appealing to the wellness-oriented segment. Despite challenges around cost and raw material sourcing, natural flavors are particularly favored in premium and functional beverage categories, reinforcing their leading market position.
Based on beverage type, non-alcoholic drinks emerged as the largest contributor, holding a market size of USD 3.4 billion in 2024. The strong presence of this segment is attributed to high daily consumption rates, product variety, and a broad consumer base. From hydration products to energy-enhancing formulations, the non-alcoholic category consistently demands innovative flavor solutions to maintain consumer interest. On the other hand, alcoholic beverages, though smaller in market size, are witnessing notable growth fueled by rising demand for premium, flavored alcoholic drinks.
Regarding flavor types, fruit flavors led the category, accounting for USD 1.7 billion in 2024. These flavors continue to dominate due to their natural association with wellness, wide compatibility with various beverage types, and cost-efficiency. The versatility of fruit flavors allows for both standalone applications and complex blends, making them a favorite among manufacturers aiming to deliver unique and refreshing taste experiences.
Regionally, China leads the Asia Pacific beverage flavoring system market with a market value of USD 663.1 million in 2024 and is projected to grow at a CAGR of 5.6% through 2034. The country's large consumer base, urban expansion, and increasing appetite for flavored and functional drinks are fueling this growth. Strong domestic manufacturing capabilities and favorable food safety regulations have further strengthened China's position. As consumer demand continues to shift toward health-conscious and flavor-rich beverage options, China remains a central hub for innovation and production in the region.
Global flavor system providers are leveraging their technical expertise, diverse product lines, and expansive distribution networks to tap into the growing demand. Their competitive edge lies in their ability to adapt quickly, invest heavily in innovation, and offer consistent quality across multiple regions.
Table of Contents
Chapter 1 Methodology
- 1.1 Market scope and definition
- 1.2 Research design
- 1.2.1 Research approach
- 1.2.2 Data collection methods
- 1.3 Data mining sources
- 1.3.1 Global
- 1.3.2 Regional/Country
- 1.4 Base estimates and calculations
- 1.4.1 Base year calculation
- 1.4.2 Key trends for market estimation
- 1.5 Primary research and validation
- 1.5.1 Primary sources
- 1.6 Forecast model
- 1.7 Research assumptions and limitations
Chapter 2 Executive Summary
- 2.1 Industry 3600 synopsis
- 2.2 Key market trends
- 2.2.1 Regional
- 2.2.2 Ingredient type
- 2.2.3 Form
- 2.2.4 Origin
- 2.2.5 Beverage type
- 2.2.6 Flavor type
- 2.3 TAM Analysis, 2025-2034
- 2.4 CXO perspectives: Strategic imperatives
- 2.4.1 Executive decision points
- 2.4.2 Critical success factors
- 2.5 Future Outlook and Strategic Recommendations
Chapter 3 Industry Insights
- 3.1 Industry ecosystem analysis
- 3.1.1 Supplier landscape
- 3.1.2 Profit margin
- 3.1.3 Value addition at each stage
- 3.1.4 Factor affecting the value chain
- 3.1.5 Disruptions
- 3.2 Industry impact forces
- 3.2.1 Growth drivers
- 3.2.2 Industry pitfalls and challenges
- 3.2.3 Market opportunities
- 3.3 Growth potential analysis
- 3.4 Regulatory landscape
- 3.4.1 North America
- 3.4.2 Europe
- 3.4.3 Asia Pacific
- 3.4.4 Latin America
- 3.4.5 Middle East & Africa
- 3.5 Porter's analysis
- 3.6 PESTEL analysis
- 3.6.1 Technology and innovation landscape
- 3.6.2 Current technological trends
- 3.6.3 Emerging technologies
- 3.7 Price trends
- 3.7.1 By region
- 3.7.2 By product
- 3.8 Future market trends
- 3.9 Technology and Innovation landscape
- 3.9.1 Current technological trends
- 3.9.2 Emerging technologies
- 3.10 Patent Landscape
- 3.11 Trade statistics (HS code) ( Note: the trade statistics will be provided for key countries only )
- 3.11.1 Major importing countries
- 3.11.2 Major exporting countries
- 3.12 Sustainability and environmental aspects
- 3.12.1 Sustainable practices
- 3.12.2 Waste reduction strategies
- 3.12.3 Energy efficiency in production
- 3.12.4 Eco-friendly initiatives
- 3.13 Emerging trends and future outlook
- 3.13.1 Technological innovations
- 3.13.1.1 Ai and machine learning in flavor development
- 3.13.1.2 Advanced encapsulation technologies
- 3.13.1.3 Biotechnology in flavor production
- 3.13.2 Consumer preference evolution
- 3.13.2.1 Clean label movement
- 3.13.2.2 Functional flavors
- 3.13.2.3 Global and exotic flavor profiles
- 3.13.3 Health and wellness trends
- 3.13.4 Sugar reduction solutions
- 3.13.5 Immunity-boosting flavors
- 3.13.6 Adaptogenic and nootropic flavors
- 3.13.7 Personalization and customization
- 3.13.8 Digital transformation in flavor industry
- 3.13.9 Integration with alternative beverage categories
- 3.13.9.1 Plant-based beverages
- 3.13.9.2 Low/no-alcohol beverages
- 3.13.9.3 Functional beverages
- 3.13.10 Future market potential
- 3.13.11 Investment opportunities
- 3.13.1 Technological innovations
Chapter 4 Competitive Landscape, 2024
- 4.1 Introduction
- 4.2 Company market share analysis
- 4.2.1 By region
- 4.2.1.1 North America
- 4.2.1.2 Europe
- 4.2.1.3 Asia Pacific
- 4.2.1.4 LATAM
- 4.2.1.5 MEA
- 4.2.1 By region
- 4.3 Company matrix analysis
- 4.4 Competitive analysis of major market players
- 4.5 Competitive positioning matrix
- 4.6 Key developments
- 4.6.1 Mergers & acquisitions
- 4.6.2 Partnerships & collaborations
- 4.6.3 New product launches
- 4.6.4 Expansion plans
Chapter 5 Market Estimates & Forecast, By Ingredient Type, 2021 - 2034 (USD Million) (Kilo Tons)
- 5.1 Key trend
- 5.2 Flavoring agents
- 5.2.1 Natural flavors
- 5.2.1.1 Fruit flavors
- 5.2.1.2 Botanical flavors
- 5.2.1.3 Spice and herb flavors
- 5.2.1.4 Nut and seed flavors
- 5.2.1.5 Others
- 5.2.2 Artificial flavors
- 5.2.2.1 Fruit mimics
- 5.2.2.2 Sweet flavors
- 5.2.2.3 Savory flavors
- 5.2.2.4 Others
- 5.2.3 Nature-identical flavors
- 5.2.1 Natural flavors
- 5.3 Flavor carriers
- 5.3.1 Propylene glycol
- 5.3.2 Ethanol
- 5.3.3 Vegetable oils
- 5.3.4 Others
- 5.4 Flavor enhancers
- 5.4.1 Acidulants
- 5.4.2 Sweeteners
- 5.4.3 Others
- 5.5 Flavor modifiers
Chapter 6 Market Estimates & Forecast, By Form, 2021 - 2034 (USD Million) (Kilo Tons)
- 6.1 Key trend
- 6.2 Liquid
- 6.2.1 Emulsions
- 6.2.2 Solutions
- 6.2.3 Suspensions
- 6.3 Dry
- 6.3.1 Spray-dried
- 6.3.2 Freeze-dried
- 6.3.3 Encapsulated
- 6.3.4 Others
Chapter 7 Market Estimates & Forecast, By Origin, 2021 - 2034 (USD Million) (Kilo Tons)
- 7.1 Key trend
- 7.2 Natural
- 7.2.1 Plant-based
- 7.2.2 Animal-derived
- 7.3 Artificial
- 7.4 Nature-identical
Chapter 8 Market Estimates & Forecast, By Beverage Type, 2021 - 2034 (USD Million) (Kilo Tons)
- 8.1 Key trend
- 8.2 Alcoholic beverages
- 8.2.1 Beer
- 8.2.2 Wine
- 8.2.3 Spirits
- 8.2.4 Ready-to-Drink (RTD) alcoholic beverages
- 8.2.5 Others
- 8.3 Non-alcoholic beverages
- 8.3.1 Carbonated soft drinks
- 8.3.2 Juices and nectars
- 8.3.3 Energy drinks
- 8.3.4 Sports drinks
- 8.3.5 Ready-to-Drink (RTD) tea and coffee
- 8.3.6 Flavored water
- 8.3.7 Dairy-based beverages
- 8.3.8 Plant-based beverages
- 8.3.9 Others
Chapter 9 Market Estimates & Forecast, By Flavor Type, 2021 - 2034 (USD Million) (Kilo Tons)
- 9.1 Key trend
- 9.2 Fruit flavors
- 9.2.1 Berries
- 9.2.2 Citrus
- 9.2.3 Tropical
- 9.2.4 Stone fruits
- 9.2.5 Others
- 9.3 Chocolate and vanilla
- 9.4 Coffee and tea
- 9.5 Spices and herbs
- 9.6 Floral flavors
- 9.7 Nut and seed flavors
- 9.8 Mint and menthol
- 9.9 Sweet flavors
- 9.10 Savory flavors
- 9.11 Others
Chapter 10 Market Estimates & Forecast, By Region, 2021 - 2034 (USD Million) (Kilo Tons)
- 10.1 Key trends
- 10.2 North America
- 10.2.1 U.S.
- 10.2.2 Canada
- 10.3 Europe
- 10.3.1 Germany
- 10.3.2 UK
- 10.3.3 France
- 10.3.4 Italy
- 10.3.5 Spain
- 10.3.6 Rest of Europe
- 10.4 Asia Pacific
- 10.4.1 China
- 10.4.2 India
- 10.4.3 Japan
- 10.4.4 Australia
- 10.4.5 South Korea
- 10.4.6 Rest of Asia Pacific
- 10.5 Latin America
- 10.5.1 Brazil
- 10.5.2 Mexico
- 10.5.3 Argentina
- 10.5.4 Rest of Latin America
- 10.6 Middle East & Africa
- 10.6.1 Saudi Arabia
- 10.6.2 South Africa
- 10.6.3 UAE
- 10.6.4 Rest of Middle East & Africa
Chapter 11 Company Profiles
- 11.1 Givaudan SA
- 11.2 International Flavors & Fragrances Inc. (IFF)
- 11.3 DSM
- 11.4 Symrise AG
- 11.5 Sensient Technologies Corporation
- 11.6 Kerry Group plc
- 11.7 Archer Daniels Midland Company (ADM)
- 11.8 Tate & Lyle PLC
- 11.9 Cargill, Incorporated
- 11.10 MANE SA
- 11.11 McCormick & Company, Inc.
- 11.12 Takasago International Corporation
- 11.13 T. Hasegawa Co., Ltd.
- 11.14 Robertet Group
- 11.15 Kalsec Inc.

