
PUBLISHER: Global Market Insights Inc. | PRODUCT CODE: 1773227

PUBLISHER: Global Market Insights Inc. | PRODUCT CODE: 1773227
Ruminant Methane Reduction Market Opportunity, Growth Drivers, Industry Trend Analysis, and Forecast 2025 - 2034
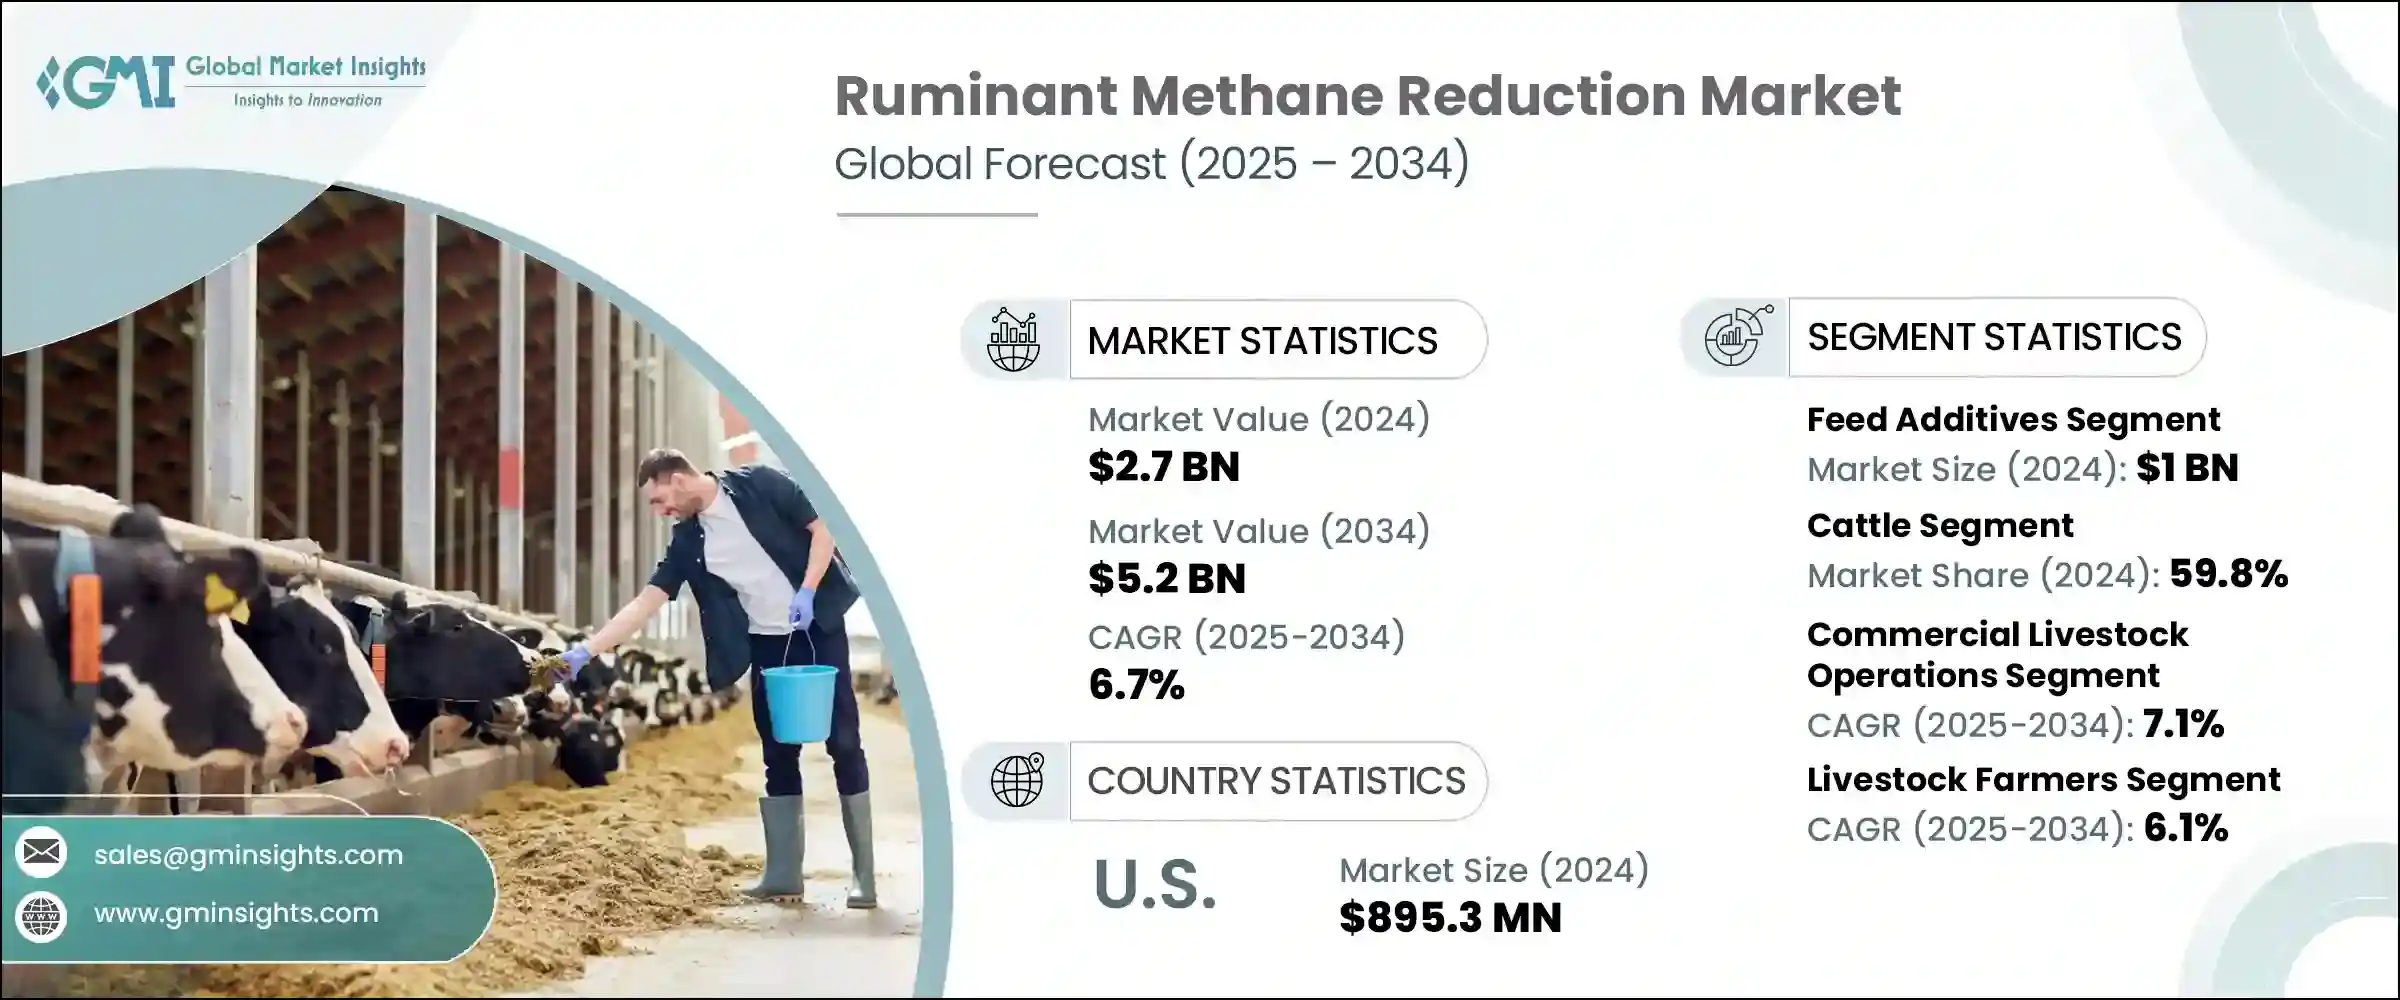
The Global Ruminant Methane Reduction Market was valued at USD 2.7 billion in 2024 and is estimated to grow at a CAGR of 6.7% to reach USD 5.2 billion by 2034. This growth reflects the increasing imperative to reduce methane emissions from cattle, sheep, and goats, which largely result from enteric fermentation. With global demand for animal-based proteins on the rise, tackling ruminant methane output is essential to meet climate targets, enhance production efficiency, and support sustainable farming practices.
Mitigation approaches include dietary additives, genetic selection, pasture management, and increased herd productivity. Feed additives such as 3-nitrooxypropanol (3-NOP) and seaweed-derived products have shown methane reductions of up to 80% without sacrificing animal performance. National and corporate climate programs are combining subsidies, carbon credit systems, and policy frameworks to drive adoption. While scalability and local adaptation challenges persist, coupling feed-based strategies with circular bioeconomy solutions, like manure digesters, is further enhancing methane mitigation efforts.
| Market Scope | |
|---|---|
| Start Year | 2024 |
| Forecast Year | 2025-2034 |
| Start Value | $2.7 Billion |
| Forecast Value | $5.2 Billion |
| CAGR | 6.7% |
While scalability and adaptation to local farming conditions continue to pose hurdles, the integration of feed-based strategies with broader circular bioeconomy practices is proving increasingly effective in amplifying methane reduction efforts. By aligning methane inhibitors and natural feed additives with systems such as manure anaerobic digesters, farms can create closed-loop operations that tackle emissions from both enteric fermentation and waste decomposition. This dual approach not only boosts overall environmental impact but also generates additional value streams, such as renewable energy and organic fertilizers.
The feed additives segment in the ruminant methane reduction market generated USD 1 billion in 2024. These dietary interventions are becoming central to methane mitigation efforts, especially as science-backed compounds like 3-Nitrooxypropanol (3-NOP) and bromoform-based solutions continue to demonstrate high efficacy in lowering enteric emissions without compromising animal productivity. Alongside synthetic inhibitors, there is rising momentum behind natural alternatives such as essential oils, plant-derived extracts, and tannins, which are being increasingly incorporated into feed due to their environmentally friendly profiles and ability to influence the microbial populations in the rumen.
The cattle segment held a 59.8% share in 2024 and is expected to grow at 7.1% CAGR through 2034. This dominance stems from their significant global population and high levels of methane production, particularly among dairy and beef cattle. Dairy cows, with their frequent dietary cycles and efficient feed utilization, are especially compatible with feed-based reduction strategies. Meanwhile, beef cattle, often raised in extensive pasture systems, present opportunities for methane reduction through grazing optimization, dietary tweaks, and genetic selection aimed at lowering emissions intensity.
U.S. Ruminant Methane Reduction Market generated USD 895.3 million in 2024. The country's leadership is backed by a combination of evolving federal and state policies, increasing adoption of climate-focused corporate mandates, and rapid innovation in emission-reducing feed solutions. American producers, particularly in the dairy and beef sectors, are rapidly incorporating additives like 3-NOP, seaweed-based compounds, and essential oils to align with voluntary carbon reduction initiatives and third-party sustainability standards. The push for certification under environmental, social, and governance (ESG) frameworks further motivates the large-scale deployment of these additives.
Leading companies in this market include Evonik Industries AG, DSM Firmenich, Cargill Incorporated, Archer Daniels Midland Company (ADM), and BASF SE. To strengthen their market position, top ruminant methane reduction companies are implementing multiple initiatives They are investing heavily in R& D to develop next-gen additives with enhanced efficacy, cost-effectiveness, and regional adaptability.
Collaborations with feed manufacturers, livestock integrators, and research institutions help accelerate product validation and scale-up. Firms are also launching pilot programs and feeding trials globally to generate performance data and regulatory approvals. Strategic partnerships with agricultural cooperatives and climate-focused initiatives are expanding access to feed additives through subsidies and carbon-credit programs. Additionally, efforts in product diversification-such as combining probiotic matrices with methane inhibitors-are helping companies differentiate offerings and meet emerging sustainability standards in livestock production.
Table of Contents
Chapter 1 Methodology and Scope
- 1.1 Market scope and definition
- 1.2 Research design
- 1.2.1 Research approach
- 1.2.2 Data collection methods
- 1.3 Data mining sources
- 1.3.1 Global
- 1.3.2 Regional/country
- 1.4 Base estimates and calculations
- 1.4.1 Base year calculation
- 1.4.2 Key trends for market estimation
- 1.5 Primary research and validation
- 1.5.1 Primary sources
- 1.6 Forecast model
- 1.7 Research assumptions and limitations
Chapter 2 Executive Summary
- 2.1 Industry 360° synopsis
- 2.2 Key market trends
- 2.2.1 Regional
- 2.2.2 Product
- 2.2.3 Ruminant
- 2.2.4 Application
- 2.2.5 End Use
- 2.3 TAM analysis, 2025-2034
- 2.4 Cxo perspectives: strategic imperatives
- 2.4.1 Executive decision points
- 2.4.2 Critical success factors
- 2.5 Future outlook and strategic recommendations
Chapter 3 Industry Insights
- 3.1 Industry ecosystem analysis
- 3.1.1 Supplier landscape
- 3.1.2 Profit margin
- 3.1.3 Value addition at each stage
- 3.1.4 Factor affecting the value chain
- 3.1.5 Disruptions
- 3.2 Industry impact forces
- 3.2.1 Growth drivers
- 3.2.2 Industry pitfalls and challenges
- 3.2.3 Market opportunities
- 3.3 Growth potential analysis
- 3.4 Regulatory landscape
- 3.4.1 North America
- 3.4.2 Europe
- 3.4.3 Asia Pacific
- 3.4.4 Latin America
- 3.4.5 Middle East & Africa
- 3.5 Porter's analysis
- 3.6 Pestel analysis
- 3.6.1 Technology and innovation landscape
- 3.6.2 Current technological trends
- 3.6.3 Emerging technologies
- 3.7 Price trends
- 3.7.1 By region
- 3.7.2 By product
- 3.8 Future market trends
- 3.9 Technology and innovation landscape
- 3.9.1 Current technological trends
- 3.9.2 Emerging technologies
- 3.10 Patent landscape
- 3.11 Trade statistics (HS code) (note: the trade statistics will be provided for key countries only)
- 3.11.1 Major importing countries
- 3.11.2 Major exporting countries
- 3.12 Sustainability and environmental aspects
- 3.12.1 Sustainable Practices
- 3.12.2 Waste reduction strategies
- 3.12.3 Energy efficiency in production
- 3.12.4 Eco-friendly initiatives
Chapter 4 Competitive landscape, 2024
- 4.1 Introduction
- 4.2 Company market share analysis
- 4.2.1 By Region
- 4.2.1.1 North America
- 4.2.1.2 Europe
- 4.2.1.3 Asia Pacific
- 4.2.1.4 LATAM
- 4.2.1.5 MEA
- 4.2.1 By Region
- 4.3 Company matrix analysis
- 4.4 Competitive analysis of major market players
- 4.5 Competitive positioning matrix
- 4.6 Key developments
- 4.6.1 Mergers & acquisitions
- 4.6.2 Partnerships & collaborations
- 4.6.3 New product launches
- 4.6.4 Expansion plans
Chapter 5 Market Estimates and Forecast, By Product, 2021 – 2034 (USD Billion) (Kilo Tons)
- 5.1 Key trends
- 5.2 Feed additives
- 5.2.1 Methane inhibitors
- 5.2.1.1 3-nitrooxypropanol (3-nop)
- 5.2.1.2 Bromoform compounds
- 5.2.1.3 Other chemical inhibitors
- 5.2.2 Natural compounds
- 5.2.2.1 Essential oils
- 5.2.2.2 Plant extracts
- 5.2.2.3 Seaweed-based additives
- 5.2.2.4 Tannins
- 5.2.3 Probiotics & prebiotics
- 5.2.3.1 Methane-reducing probiotics
- 5.2.3.2 Prebiotic compounds
- 5.2.4 Enzymes
- 5.2.5 Other feed additives
- 5.2.1 Methane inhibitors
- 5.3 Genetic & breeding solutions
- 5.3.1 Low-methane genetics
- 5.3.2 Selective breeding programs
- 5.3.3 Genomic selection tools
- 5.4 Management practices
- 5.4.1 Dietary modifications
- 5.4.1.1 High-quality forages
- 5.4.1.2 Concentrate feeding
- 5.4.1.3 Precision feeding systems
- 5.4.2 Grazing management
- 5.4.3 Herd management optimization
- 5.4.1 Dietary modifications
- 5.5 Biotechnology solutions
- 5.5.1 Rumen microbiome modification
- 5.5.2 Methanogen inhibition
- 5.5.3 Vaccine development
- 5.6 Other solutions
- 5.6.1 Alternative protein sources
- 5.6.2 Methane capture technologies
- 5.6.3 Carbon sequestration methods
Chapter 6 Market Estimates and Forecast, By Ruminant 2021 – 2034 (USD Billion) (Kilo Tons)
- 6.1 Key trends
- 6.2 Cattle
- 6.2.1 Dairy
- 6.2.2 Beef
- 6.3 Sheep
- 6.4 Goats
- 6.5 Buffalo
- 6.6 Other ruminants
- 6.6.1 Deer
- 6.6.2 Alpacas & llamas
- 6.6.3 Other species
Chapter 7 Market Estimates and Forecast, By Application, 2021 – 2034 (USD Billion) (Kilo Tons)
- 7.1 Key trends
- 7.2 Commercial livestock operations
- 7.2.1 Large-scale dairy farms
- 7.2.2 Large-scale beef operations
- 7.2.3 Feedlots
- 7.3 Small & medium farms
- 7.3.1 Family dairy farms
- 7.3.2 Mixed farming operations
- 7.3.3 Specialty livestock farms
- 7.4 Pasture-based systems
- 7.4.1 Extensive grazing systems
- 7.4.2 Rotational grazing systems
- 7.4.3 Silvopastoral systems
- 7.5 Research & development
- 7.5.1 Academic research institutions
- 7.5.2 Government research programs
- 7.5.3 Private R&D facilities
Chapter 8 Market Estimates and Forecast, By End Use 2021 – 2034 (USD Billion) (Kilo Tons)
- 8.1 Key trends
- 8.2 Livestock farmers
- 8.2.1 Dairy farmers
- 8.2.2 Beef producers
- 8.2.3 Sheep & goat farmers
- 8.3 Feed manufacturers
- 8.3.1 Commercial feed producers
- 8.3.2 Specialty feed companies
- 8.3.3 Feed additive manufacturers
- 8.4 Food & beverage companies
- 8.4.1 Dairy processors
- 8.4.2 Meat processors
- 8.4.3 Food service companies
- 8.5 Government & research institutions
- 8.5.1 Agricultural departments
- 8.5.2 Environmental agencies
- 8.5.3 Research universities
- 8.6 Others
- 8.6.1 Carbon credit developers
- 8.6.2 Consulting services
- 8.6.3 Technology integrators
Chapter 9 Market Estimates and Forecast, By Region, 2021 – 2034 (USD Billion) (Kilo Tons)
- 9.1 Key trends
- 9.2 North America
- 9.2.1 U.S.
- 9.2.2 Canada
- 9.3 Europe
- 9.3.1 Germany
- 9.3.2 UK
- 9.3.3 France
- 9.3.4 Italy
- 9.3.5 Spain
- 9.3.6 Rest of Europe
- 9.4 Asia Pacific
- 9.4.1 China
- 9.4.2 India
- 9.4.3 Japan
- 9.4.4 Australia
- 9.4.5 South Korea
- 9.4.6 Rest of Asia Pacific
- 9.5 Latin America
- 9.5.1 Brazil
- 9.5.2 Mexico
- 9.5.3 Argentina
- 9.5.4 Rest of Latin America
- 9.6 Middle East and Africa
- 9.6.1 Saudi Arabia
- 9.6.2 South Africa
- 9.6.3 UAE
- 9.6.4 Rest of MEA
Chapter 10 Company Profiles
- 10.1 Agolin SA
- 10.2 Alltech Inc.
- 10.3 Archer Daniels Midland Company (ADM)
- 10.4 ArkeaBio
- 10.5 BASF SE
- 10.6 Blue Ocean Barns
- 10.7 Cargill, Incorporated
- 10.8 Chr. Hansen Holding A/S
- 10.9 DSM-Firmenich
- 10.10 Elanco Animal Health Incorporated
- 10.11 Evonik Industries AG
- 10.12 FutureFeed Pty Ltd
- 10.13 Kemin Industries, Inc.
- 10.14 Lallemand Inc.
- 10.15 Mootral SA
- 10.16 Novozymes A/S
- 10.17 Rumin8
- 10.18 Symbrosia Inc.
- 10.19 Volta Greentech
- 10.20 Zelp Ltd

