
PUBLISHER: Global Market Insights Inc. | PRODUCT CODE: 1773265

PUBLISHER: Global Market Insights Inc. | PRODUCT CODE: 1773265
Precipitated Silica Market Opportunity, Growth Drivers, Industry Trend Analysis, and Forecast 2025 - 2034
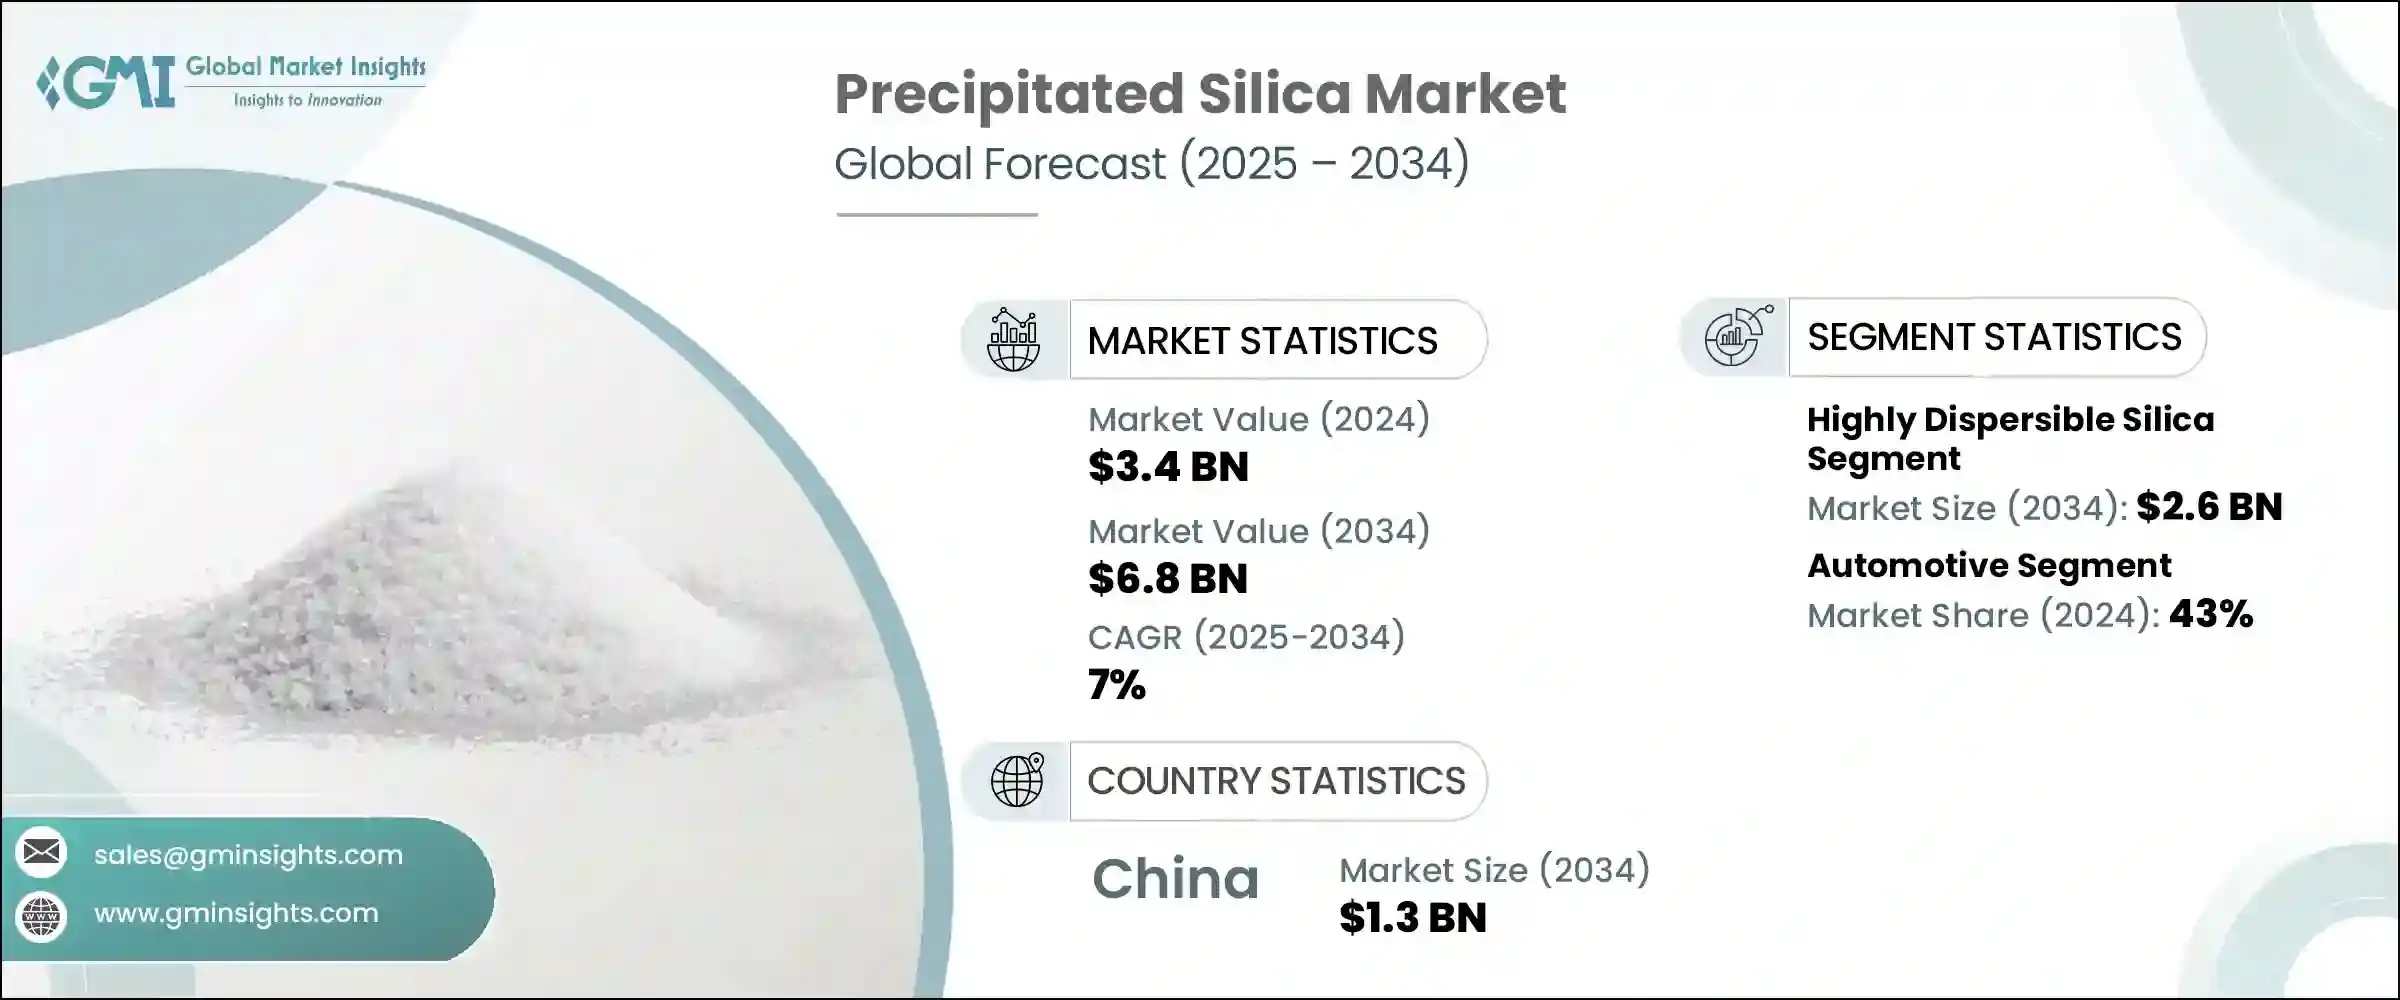
The Global Precipitated Silica Market was valued at USD 3.4 billion in 2024 and is estimated to grow at a CAGR of 7% to reach USD 6.8 billion by 2034. This market growth is driven by precipitated silica's unique physical and chemical properties, which make it a versatile ingredient across various industries. Over the past decade, its demand has steadily increased, particularly as a performance-enhancing additive in rubber, oral care products, and coatings. The ongoing trends of rapid urbanization, growing automotive production, and the increasing emphasis on environmentally friendly technologies continue to propel the market forward.
Precipitated silica's ability to improve product performance while aligning with sustainability goals positions it well for continued adoption. Emerging economies in the Asia Pacific region are fueling much of this growth, thanks to accelerated industrial development, expanding automotive sectors, and booming consumer goods markets. Countries such as China and India are not only large consumers but are also evolving as major production hubs, further solidifying the region's dominance in this sector.
| Market Scope | |
|---|---|
| Start Year | 2024 |
| Forecast Year | 2025-2034 |
| Start Value | $3.4 Billion |
| Forecast Value | $6.8 Billion |
| CAGR | 7% |
The tire and rubber industry remains the cornerstone of precipitated silica applications. Its vital role in enhancing traction, lowering rolling resistance, and boosting fuel efficiency has made it indispensable in modern tire formulations, especially for electric and high-performance vehicles. Beyond tires, precipitated silica's uses are broadening into pharmaceuticals, food processing, and personal care products, where it acts as an anti-caking agent, thickener, and detergent.
Highly dispersible silica (HDS) accounted for USD 1.3 billion in 2024 and is expected to reach USD 2.6 billion by 2034, growing at a CAGR of 7.1%. This variant is favored for its superior reinforcement capabilities and compatibility with tire rubber compounds. HDS significantly enhances rolling resistance, wet traction, and fuel economy, making it essential in the manufacture of green and high-performance tires, particularly for hybrid and electric vehicles. This aligns well with increasing global environmental regulations and original equipment manufacturers' (OEMs) demand for fuel-efficient products. The shift toward low-emission vehicles and eco-friendly tire solutions is boosting HDS adoption, reinforcing its position as a key material in future tire technologies.
In 2024, the automotive segment held a 43% share. This leadership is attributed to its widespread use in tire production, where silica improves tire grip, wear resistance, and fuel efficiency through reduced rolling resistance. With the global rise of energy-efficient, low-emission vehicles, manufacturers are increasingly incorporating silica-reinforced tires to meet regulatory standards and customer preferences. The surge in electric and hybrid vehicle production is driving demand for high-performance tires that depend heavily on precipitated silica to deliver enhanced traction and extended driving range. This trend is expected to continue as automotive manufacturers prioritize sustainable and high-quality tire materials.
U.S. Precipitated Silica Market will grow at a CAGR of 6.7% through 2034. This growth is primarily fueled by tire and rubber applications, especially with the rising sales of tires tailored for electric vehicles. Additionally, the diversification of applications into personal care, pharmaceuticals, coatings, and adhesives is helping broaden the market base. Increasing environmental concerns and regulations promoting eco-friendly materials are encouraging manufacturers to adopt sustainable silica production techniques. Leading companies are investing heavily in capacity expansion and research & development to innovate greener materials and processes, highlighting a clear industry focus on sustainability and long-term innovation in the U.S. market.
Key players in the Precipitated Silica Industry include PPG Industries, Evonik Industries, Oriental Silicas Corporation, W.R. Grace & Co., and Solvay S.A. To strengthen their foothold in the precipitated silica market, leading companies are focusing on expanding their product portfolios by developing specialized and sustainable silica grades tailored to diverse industry needs. Heavy investment in R&D is enabling innovation around eco-friendly production methods and enhanced material performance, which meets the growing demand for green and efficient solutions. Strategic partnerships and collaborations are being formed to access new geographic markets and broaden distribution networks. Companies are also enhancing customer engagement through technical support services and customized solutions, fostering stronger client relationships.
Table of Contents
Chapter 1 Methodology & Scope
- 1.1 Market scope and definition
- 1.2 Research design
- 1.2.1 Research approach
- 1.2.2 Data collection methods
- 1.3 Data mining sources
- 1.3.1 Global
- 1.3.2 Regional/Country
- 1.4 Base estimates and calculations
- 1.4.1 Base year calculation
- 1.4.2 Key trends for market estimation
- 1.5 Primary research and validation
- 1.5.1 Primary sources
- 1.6 Forecast model
- 1.7 Research assumptions and limitations
Chapter 2 Executive Summary
- 2.1 Industry 3600 synopsis
- 2.2 Key market trends
- 2.2.1 Regional
- 2.2.2 Product type
- 2.2.3 End use industry
- 2.3 TAM Analysis, 2025-2034
- 2.4 CXO perspectives: strategic imperatives
- 2.4.1 Executive decision points
- 2.4.2 Critical success factors
- 2.5 Future outlook and strategic recommendations
Chapter 3 Industry Insights
- 3.1 Industry ecosystem analysis
- 3.1.1 Supplier landscape
- 3.1.2 Profit margin
- 3.1.3 Value addition at each stage
- 3.1.4 Factor affecting the value chain
- 3.1.5 Disruptions
- 3.2 Industry impact forces
- 3.2.1 Growth drivers
- 3.2.2 Industry pitfalls and challenges
- 3.2.3 Market opportunities
- 3.3 Growth potential analysis
- 3.4 Regulatory landscape
- 3.4.1 North America
- 3.4.2 Europe
- 3.4.3 Asia Pacific
- 3.4.4 Latin America
- 3.4.5 Middle East & Africa
- 3.5 Porter's analysis
- 3.6 PESTEL analysis
- 3.6.1 Technology and Innovation landscape
- 3.6.2 Current technological trends
- 3.6.3 Emerging technologies
- 3.7 Price trends
- 3.7.1 By region
- 3.7.2 By product type
- 3.8 Future market trends
- 3.9 Technology and innovation landscape
- 3.9.1 Current technological trends
- 3.9.2 Emerging technologies
- 3.10 Patent landscape
- 3.11 Trade statistics
- 3.11.1 Major importing countries
- 3.11.2 Major exporting countries
- 3.12 Sustainability and environmental aspects
- 3.12.1 Sustainable practices
- 3.12.2 Waste reduction strategies
- 3.12.3 Energy efficiency in production
- 3.12.4 Eco-friendly initiatives
- 3.13 Carbon footprint considerations
Chapter 4 Competitive Landscape, 2024
- 4.1 Introduction
- 4.2 Company market share analysis
- 4.2.1 By region
- 4.2.1.1 North America
- 4.2.1.2 Europe
- 4.2.1.3 Asia Pacific
- 4.2.1.4 LATAM
- 4.2.1.5 MEA
- 4.2.1 By region
- 4.3 Company matrix analysis
- 4.4 Competitive analysis of major market players
- 4.5 Competitive positioning matrix
- 4.6 Key developments
- 4.6.1.1 Mergers & acquisitions
- 4.6.1.2 Partnerships & collaborations
- 4.6.1.3 New Product Launches
- 4.7 Expansion Plans
Chapter 5 Market Estimates and Forecast, By Product Type, 2021 - 2034 (USD Billion) (Tons)
- 5.1 Key trends
- 5.2 Highly dispersible silica
- 5.3 Conventional precipitated silica
- 5.4 Surface-treated silica
- 5.5 Specialty precipitated silica
Chapter 6 Market Estimates and Forecast, By Grade, 2021 - 2034 (USD Billion) (Tons)
- 6.1 Key trends
- 6.2 Industrial grade
- 6.3 Food Grade
- 6.4 Pharmaceutical grade
- 6.5 Cosmetic grade
- 6.6 Others
Chapter 7 Market Estimates and Forecast, By Application, 2021 - 2034 (USD Billion) (Tons)
- 7.1 Key trends
- 7.2 Rubber
- 7.2.1 Tire applications
- 7.2.1.1 Passenger car tires
- 7.2.1.2 Commercial vehicle tires
- 7.2.1.3 Off-road tires
- 7.2.1.4 Others
- 7.2.2 Non-tire rubber applications
- 7.2.2.1 Footwear
- 7.2.2.2 Industrial rubber products
- 7.2.2.3 Others
- 7.2.1 Tire applications
- 7.3 Oral care
- 7.3.1 Toothpaste
- 7.3.2 Other oral care products
- 7.4 Food and feed additives
- 7.4.1 Anti-caking agents
- 7.4.2 Carriers
- 7.4.3 Others
- 7.5 Industrial applications
- 7.5.1 Paints and coatings
- 7.5.2 Plastics
- 7.5.3 Adhesives and sealants
- 7.5.4 Others
- 7.6 Personal care and cosmetics
- 7.6.1 Skin care products
- 7.6.2 Hair care products
- 7.6.3 Others
- 7.7 Pharmaceuticals
- 7.7.1 Tablet excipients
- 7.7.2 Others
- 7.8 Agriculture
- 7.9 Others
Chapter 8 Market Estimates and Forecast, By End Use Industry, 2021 - 2034 (USD Billion) (Tons)
- 8.1 Key trends
- 8.2 Automotive
- 8.3 Consumer goods
- 8.4 Food and beverage
- 8.5 Healthcare and pharmaceuticals
- 8.6 Industrial
- 8.7 Construction
- 8.8 Agriculture
- 8.9 Others
Chapter 9 Market Estimates and Forecast, By Manufacturing Process, 2021 - 2034 (USD Billion) (Tons)
- 9.1 Key trends
- 9.2 Wet process
- 9.3 Dry process
- 9.4 Others
Chapter 10 Market Estimates and Forecast, By Region, 2021 - 2034 (USD Billion) (Tons)
- 10.1 Key trends
- 10.2 North America
- 10.2.1 U.S.
- 10.2.2 Canada
- 10.3 Europe
- 10.3.1 Germany
- 10.3.2 UK
- 10.3.3 France
- 10.3.4 Spain
- 10.3.5 Italy
- 10.3.6 Rest of Europe
- 10.4 Asia Pacific
- 10.4.1 China
- 10.4.2 India
- 10.4.3 Japan
- 10.4.4 Australia
- 10.4.5 South Korea
- 10.4.6 Rest of Asia Pacific
- 10.5 Latin America
- 10.5.1 Brazil
- 10.5.2 Mexico
- 10.5.3 Argentina
- 10.5.4 Rest of Latin America
- 10.6 Middle East and Africa
- 10.6.1 Saudi Arabia
- 10.6.2 South Africa
- 10.6.3 UAE
- 10.6.4 Rest of Middle East and Africa
Chapter 11 Company Profiles
- 11.1 Anten Chemical Co., Ltd.
- 11.2 Evonik Industries AG
- 11.3 Gujarat Multi Gas Base Chemicals Pvt. Ltd.
- 11.4 Huber Engineered Materials
- 11.5 Madhu Silica Pvt. Ltd.
- 11.6 Oriental Silicas Corporation
- 11.7 PPG Industries, Inc.
- 11.8 PQ Corporation
- 11.9 Quechen Silicon Chemical Co., Ltd.
- 11.10 Shandong Link Silica Co., Ltd.
- 11.11 Solvay S.A.
- 11.12 Tata Chemicals Ltd.
- 11.13 Tosoh Silica Corporation
- 11.14 W. R. Grace & Co.
- 11.15 Wacker Chemie AG

