
PUBLISHER: Global Market Insights Inc. | PRODUCT CODE: 1773409

PUBLISHER: Global Market Insights Inc. | PRODUCT CODE: 1773409
U.S. Golf Cart Market Opportunity, Growth Drivers, Industry Trend Analysis, and Forecast 2025 - 2034
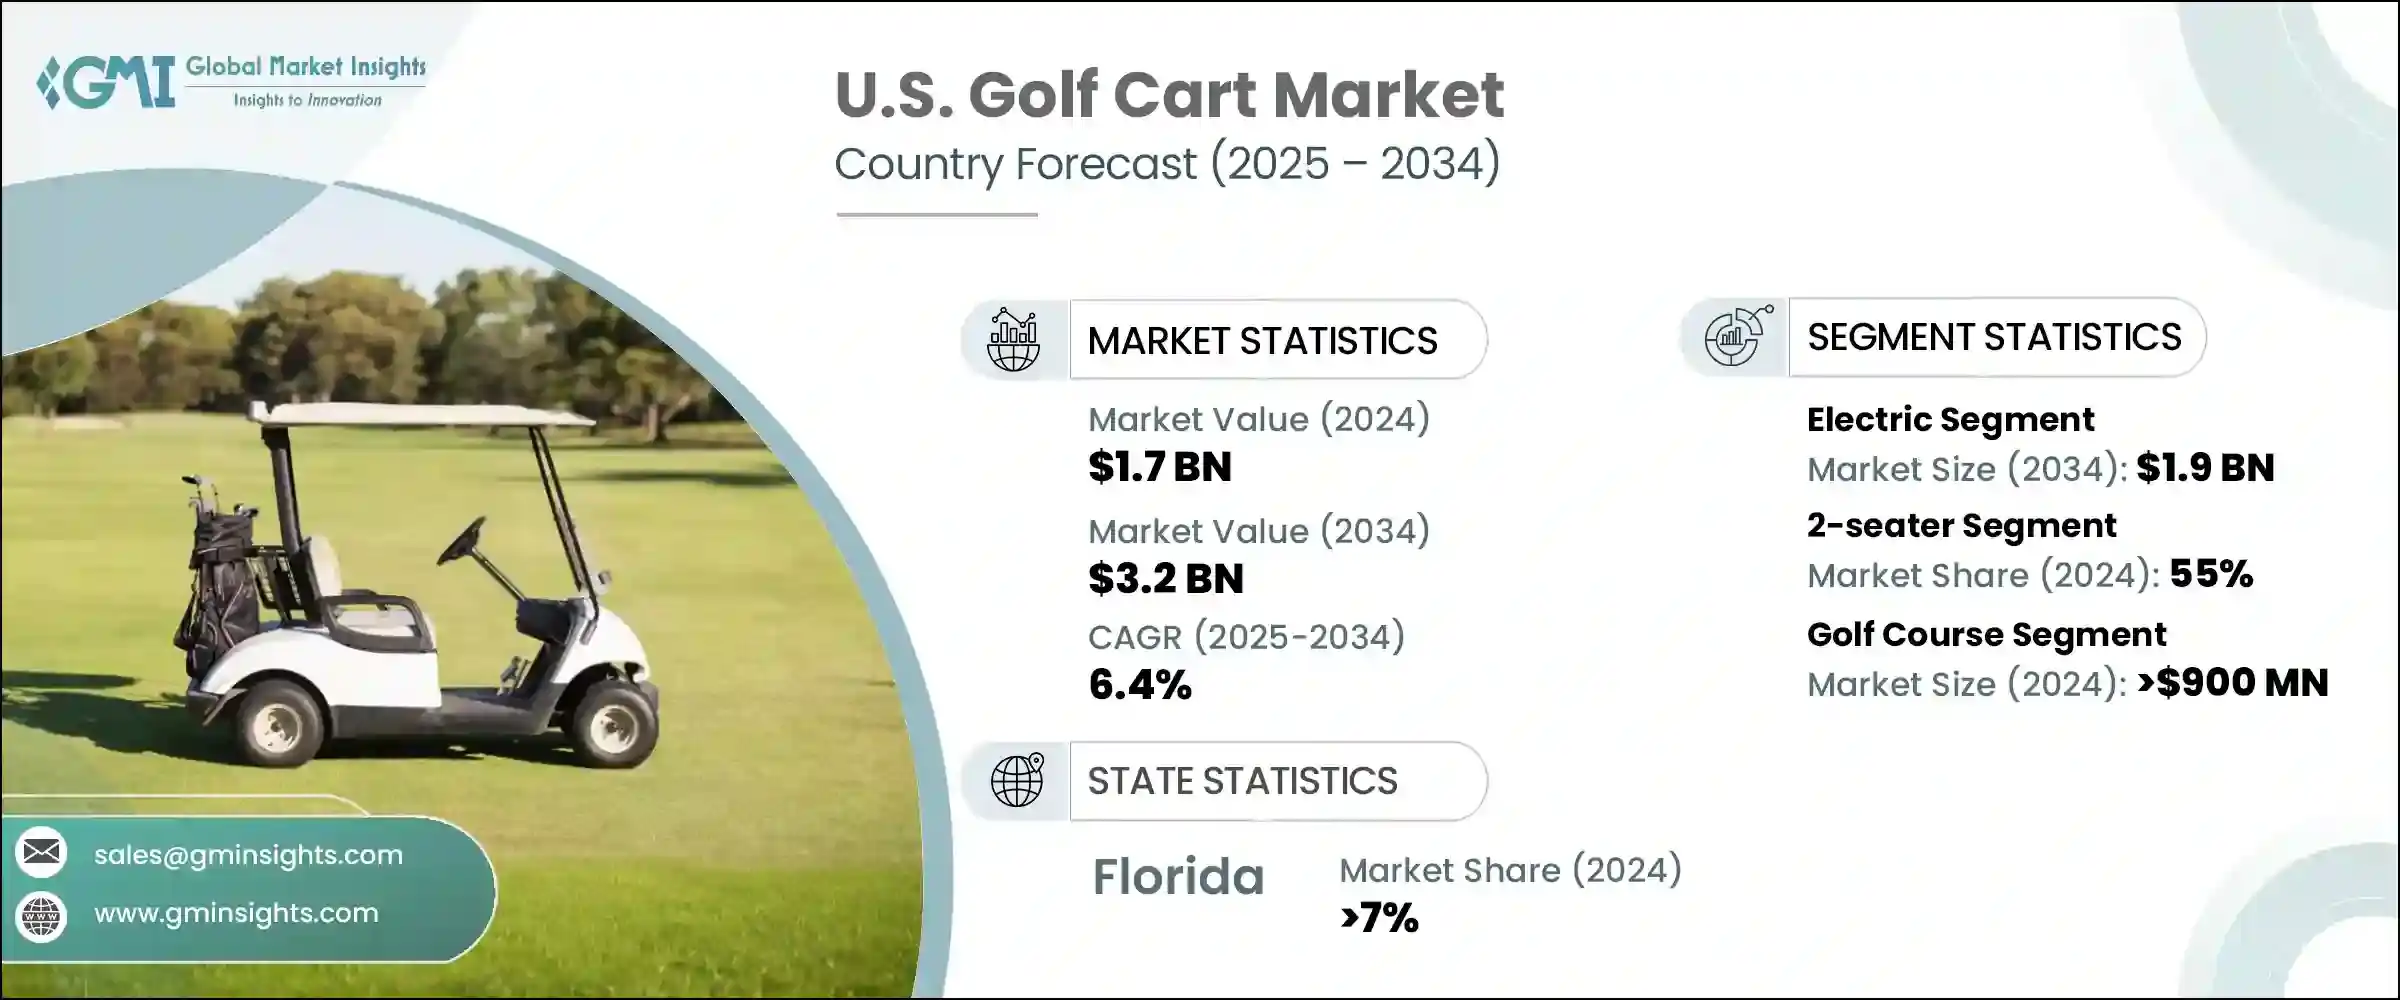
U.S. Golf Cart Market was valued at USD 1.7 billion in 2024 and is estimated to grow at a CAGR of 6.4% to reach USD 3.2 billion by 2034. This steady expansion is supported by the country's massive golf course network, which includes over 16,000 operational layouts, all contributing to recurring demand for fleet replacements. Golf cart manufacturers are reinforcing their presence through strategic collaborations and sponsorships with high-profile sports institutions to elevate brand recognition.
At the same time, low-speed vehicles, particularly those approved for street use, are redefining short-distance mobility across the U.S. Responding to this demand, OEMs are introducing new cart models that blend commuter comfort with legal road operation. With federal EV tax credits reaching up to USD 7,500 for select electric golf cars, more consumers and fleet operators are leaning toward battery-powered options that offer better range, faster charging, and reduced maintenance. These trends are also being driven by growing demand in commercial sectors-such as construction, landscaping, and hospitality-where durable, utility-focused golf carts are quickly becoming an essential asset.
| Market Scope | |
|---|---|
| Start Year | 2024 |
| Forecast Year | 2025-2034 |
| Start Value | $1.7 Billion |
| Forecast Value | $3.2 Billion |
| CAGR | 6.4% |
The electric golf carts segment generated USD 1 billion in 2024 and is projected to reach USD 1.9 billion by 2034. This surge in popularity is a result of enhanced battery technologies, integrated smart features, and heightened demand for clean-energy transportation. Golf course operators, educational institutions, and retirement communities are prioritizing electric models due to their quiet performance and non-polluting emissions. Improved battery life and accessible solar-powered charging solutions have removed past concerns related to range limitations. These features align perfectly with corporate green initiatives and stricter local laws aimed at cutting down air and noise pollution from traditional fuel-based vehicles.
The Two-seater golf carts segment captured a 55% share in 2024 and is set for notable growth through 2034. Their popularity stems from their adaptability, maneuverability, and compact design, making them ideal for standard golf course layouts and short-range travel needs. These carts are commonly used by individual golfers and small groups, and their ability to navigate narrow pathways with ease makes them a go-to option in both recreational and residential environments. Their lightweight frame and operational efficiency also make them suitable for gated communities, academic campuses, and recreational parks where smaller vehicles are preferred.
Florida Golf Cart Market generated USD 123.6 million in 2024 and held a 7% share. The state's leadership is anchored by its large population of retirees, a high density of golf facilities, and favorable weather conditions that support year-round outdoor activity. Golf carts have evolved from recreational assets into practical transport solutions within the state's many planned communities and coastal towns. Regulations in certain municipalities allow for legal on-road use of golf carts, further boosting their role in everyday travel.
Major companies dominating the U.S. Golf Cart Market include Club Car, Yamaha, EZ Go, STAR EV, Cushman, Evolution, and Marshell. These players continue to lead in innovation and customer reach. To build stronger market positions, golf cart manufacturers in the U.S. are employing several targeted strategies. Companies are enhancing their product lines with advanced electric powertrains, improved seating configurations, and user-focused infotainment systems to appeal to both private buyers and commercial users. Partnerships with residential communities, resorts, and event organizers are helping brands gain long-term contracts and high-volume fleet sales. Additionally, many firms are increasing their visibility through dealer expansion and strengthening after-sales support networks. Offering financing programs and leveraging government incentives are also tactics being used to drive adoption among both individuals and institutional buyers.
Table of Contents
Chapter 1 Methodology
- 1.1 Market scope and definition
- 1.2 Research design
- 1.2.1 Research approach
- 1.2.2 Data collection methods
- 1.3 Data mining sources
- 1.3.1 States
- 1.4 Base estimates and calculations
- 1.4.1 Base year calculation
- 1.4.2 Key trends for market estimation
- 1.5 Primary research and validation
- 1.5.1 Primary sources
- 1.6 Forecast model
- 1.7 Research assumptions and limitations
Chapter 2 Executive Summary
- 2.1 Industry 360° synopsis
- 2.2 Key market trends
- 2.2.1 States
- 2.2.2 Fuel
- 2.2.3 Seating Capacity
- 2.2.4 Application
- 2.3 TAM Analysis, 2025-2034
- 2.4 CXO perspectives: Strategic imperatives
- 2.4.1 Executive decision points
- 2.4.2 Critical success factors
- 2.5 Future outlook and strategic recommendations
Chapter 3 Industry Insights
- 3.1 Industry ecosystem analysis
- 3.1.1 Supplier landscape
- 3.1.2 Profit margin
- 3.1.3 Cost structure
- 3.1.4 Value addition at each stage
- 3.1.5 Factor affecting the value chain
- 3.1.6 Disruptions
- 3.2 Industry impact forces
- 3.2.1 Growth drivers
- 3.2.1.1 Aging population and retirement community expansion
- 3.2.1.2 Electric vehicle adoption and environmental sustainability
- 3.2.1.3 Tourism and resort industry expansion
- 3.2.1.4 Urbanization and alternative transportation solutions
- 3.2.1.5 Golf participation growth and course development
- 3.2.2 Industry pitfalls and challenges
- 3.2.2.1 High initial costs and battery technology expenses
- 3.2.2.2 Regulatory compliance and safety standards
- 3.2.2.3 Limited charging infrastructure development
- 3.2.3 Market opportunities
- 3.2.3.1 Adoption of golf carts for intra-community and micro-mobility use
- 3.2.3.2 Rising demand for street-legal and low-speed vehicle (LSV) variants
- 3.2.3.3 Growth of rental and shared fleet models in hospitality and recreation
- 3.2.3.4 Expansion of used and refurbished golf cart sales channels
- 3.2.1 Growth drivers
- 3.3 Growth potential analysis
- 3.4 Regulatory landscape
- 3.5 Porter's analysis
- 3.6 PESTEL analysis
- 3.7 Technology and innovation landscape
- 3.7.1 Current technological trends
- 3.7.2 Emerging technologies
- 3.8 Price trends
- 3.8.1 By states
- 3.8.2 By product
- 3.9 Production statistics
- 3.9.1 Production hubs
- 3.9.2 Consumption hubs
- 3.9.3 Export and import
- 3.10 Cost breakdown analysis
- 3.11 MSRP analysis
- 3.12 Patent analysis
- 3.13 Sustainability and environmental aspects
- 3.13.1 Sustainable practices
- 3.13.2 Waste reduction strategies
- 3.13.3 Energy efficiency in production
- 3.13.4 Eco-friendly initiatives
- 3.13.5 Carbon footprint considerations
- 3.14 Consumer behavior analysis
- 3.14.1 Key buyer groups by application
- 3.14.2 Influencing factors in purchase (pricing, brand reputation, seating capacity, power type)
- 3.15 Analysis of insurance and aftermarket trends
- 3.15.1 Insurance premiums and usage-based risk assessment
- 3.15.2 Aftermarket customization, upgrades, and service patterns
- 3.15.3 Maintenance cost patterns and component replacement availability
Chapter 4 Competitive Landscape, 2024
- 4.1 Introduction
- 4.2 Company market share analysis
- 4.3 Competitive analysis of major market players
- 4.4 Competitive positioning matrix
- 4.5 Strategic outlook matrix
- 4.6 Key developments
- 4.6.1 Mergers & acquisitions
- 4.6.2 Partnerships & collaborations
- 4.6.3 New product launches
- 4.6.4 Expansion plans and funding
- 4.7 Product benchmarking
- 4.7.1 Drive system and terrain handling
- 4.7.2 Range per charge and energy efficiency
- 4.7.3 Frame durability and payload capacity
- 4.7.4 Comfort, controls, and connectivity
- 4.7.5 Maintenance, spare availability, and service access
Chapter 5 Market Estimates & Forecast, By Fuel, 2021 - 2034 (USD Million, Units)
- 5.1 Key trends
- 5.2 Gasoline
- 5.3 Electric
- 5.4 Solar-powered
Chapter 6 Market Estimates & Forecast, By Seating Capacity, 2021 - 2034 (USD Million, Units)
- 6.1 Key trends
- 6.2 2-Seater
- 6.3 4-Seater
- 6.4 6-Seater
- 6.5 Others
Chapter 7 Market Estimates & Forecast, By Application, 2021 - 2034 (USD Million, Units)
- 7.1 Key trends
- 7.2 Golf courses
- 7.3 Commercial services
- 7.4 PTV/SLV
Chapter 8 Market Estimates & Forecast, By Region, 2021 - 2034 ($Bn, Units)
- 8.1 Key trends
- 8.2 U.S.
- 8.2.1 Alabama
- 8.2.2 Alaska
- 8.2.3 Arizona
- 8.2.4 Arkansas
- 8.2.5 California
- 8.2.6 Colorado
- 8.2.7 Connecticut
- 8.2.8 Delaware
- 8.2.9 Florida
- 8.2.10 Georgia
- 8.2.11 Hawaii
- 8.2.12 Idaho
- 8.2.13 Illinois
- 8.2.14 Indiana
- 8.2.15 Iowa
- 8.2.16 Kansas
- 8.2.17 Kentucky
- 8.2.18 Louisiana
- 8.2.19 Maine
- 8.2.20 Maryland
- 8.2.21 Massachusetts
- 8.2.22 Michigan
- 8.2.23 Minnesota
- 8.2.24 Mississippi
- 8.2.25 Missouri
- 8.2.26 Montana
- 8.2.27 Nebraska
- 8.2.28 Nevada
- 8.2.29 New Hampshire
- 8.2.30 New Jersey
- 8.2.31 New Mexico
- 8.2.32 New York
- 8.2.33 North Carolina
- 8.2.34 North Dakota
- 8.2.35 Ohio
- 8.2.36 Oklahoma
- 8.2.37 Oregon
- 8.2.38 Pennsylvania
- 8.2.39 Rhode Island
- 8.2.40 South Carolina
- 8.2.41 South Dakota
- 8.2.42 Tennessee
- 8.2.43 Texas
- 8.2.44 Utah
- 8.2.45 Vermont
- 8.2.46 Virginia
- 8.2.47 Washington
- 8.2.48 West Virginia
- 8.2.49 Wisconsin
- 8.2.50 Wyoming
Chapter 9 Company Profiles
- 9.1 Atlas Carts
- 9.2 Bintelli Electric Vehicles
- 9.3 Club Car
- 9.4 Columbia Vehicle Group
- 9.5 Cushman California
- 9.6 Evolution Electric Vehicles
- 9.7 EZ-GO
- 9.8 Garia
- 9.9 GEMcar
- 9.10 HDK Electric Vehicles
- 9.11 ICON Electric Vehicles
- 9.12 John Deere
- 9.13 Kubota Corporation
- 9.14 Luxe Electric Cars
- 9.15 LVTONG
- 9.16 Star EV Corporation
- 9.17 Suzhou Eagle Electric Vehicle Manufacturing
- 9.18 The Toro Company
- 9.19 Tomberlin
- 9.20 Yamaha

