
PUBLISHER: Global Market Insights Inc. | PRODUCT CODE: 1773429

PUBLISHER: Global Market Insights Inc. | PRODUCT CODE: 1773429
Phasor Measurement Unit Market Opportunity, Growth Drivers, Industry Trend Analysis, and Forecast 2025 - 2034
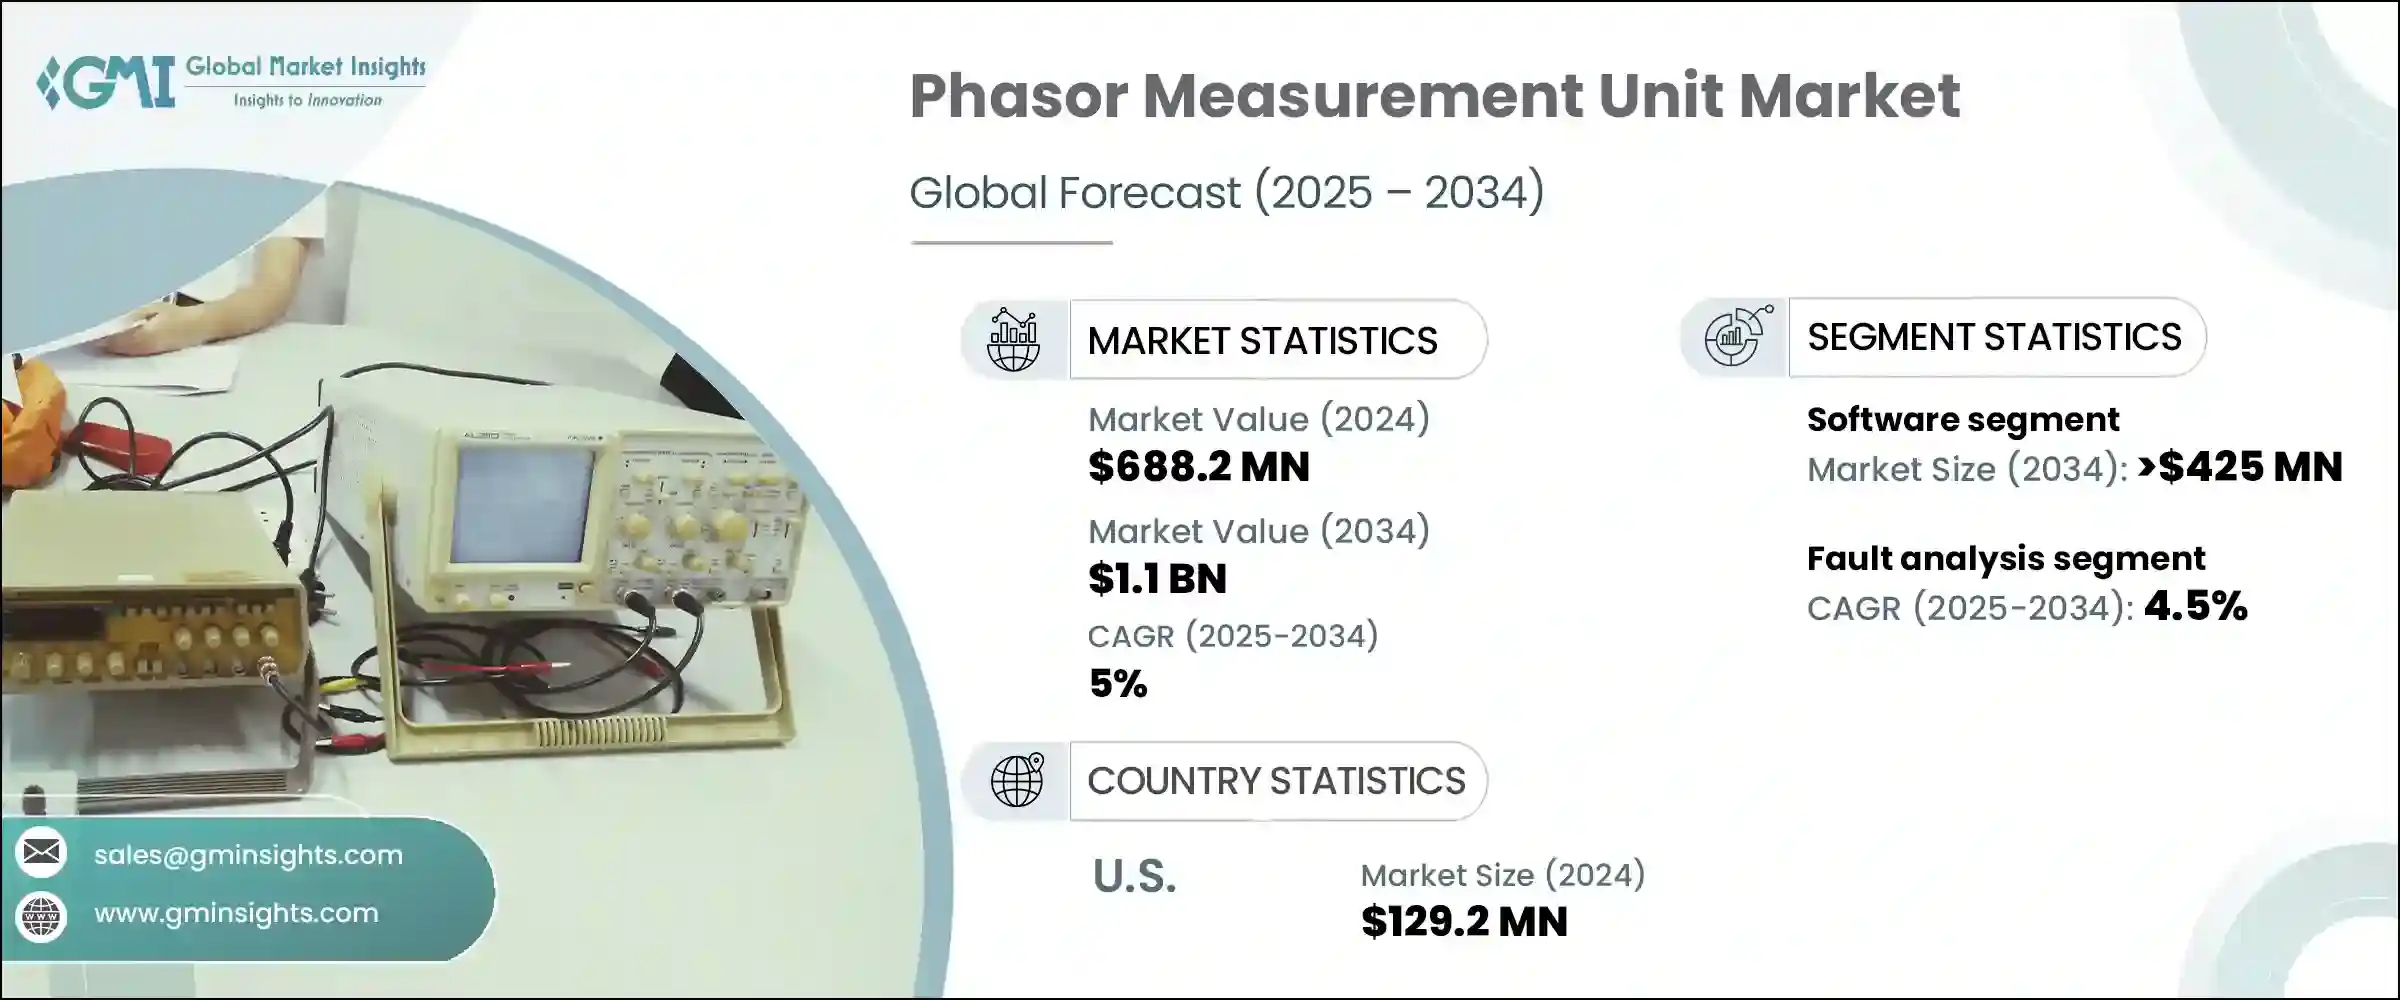
The Global Phasor Measurement Unit Market was valued at USD 688.2 million in 2024 and is estimated to grow at a CAGR of 5% to reach USD 1.1 billion by 2034. This growth is fueled by the increasing global demand for smarter, more robust power grids that can withstand the challenges posed by the integration of renewable energy and aging infrastructure. Utilities worldwide are turning to PMUs as a critical solution for real-time grid visibility, faster fault detection, and improved dynamic grid control. These advanced devices are becoming integral in modernizing transmission and distribution networks, driven by supportive regulatory frameworks and long-term energy strategies focused on reliability and resilience.
As power networks become more decentralized and complex, the use of PMUs is accelerating, particularly in emerging markets where energy demand continues to rise. Technological innovations are making PMUs more efficient, scalable, and affordable. Enhanced performance in measurement precision, data processing, and communication technologies is empowering utilities to leverage predictive maintenance and better grid forecasting through advanced analytics and smart grid management systems. The evolution of these systems is playing a significant role in expanding the global adoption of PMUs across both developed and developing regions.
| Market Scope | |
|---|---|
| Start Year | 2024 |
| Forecast Year | 2025-2034 |
| Start Value | $688.2 Million |
| Forecast Value | $1.1 Billion |
| CAGR | 5% |
The software segment of the Phasor Measurement Unit Market is forecasted to generate USD 425 million by 2034, with its growth driven largely by the integration of cutting-edge data science tools and artificial intelligence models. These tools allow utilities to carry out real-time fault detection, proactive grid monitoring, and condition-based maintenance strategies with higher efficiency. Improved software platforms offer deeper insights into operational data, helping utilities make informed decisions that enhance overall grid performance.
Meanwhile, the state estimation application segment is expected to generate USD 277 million by 2034. With the increased integration of renewable sources, distributed energy systems, and digital technologies, power grids are becoming more intricate. This complexity heightens the potential for system anomalies, making accurate and continuous state estimation essential to maintain system reliability and prevent failures.
United States Phasor Measurement Unit Market generated USD 129.2 million in 2024. This progress is attributed to sustained investments in smart grid technologies, grid infrastructure upgrades, and the growing need for advanced, real-time measurement systems. As the country continues to push for clean energy transformation, PMUs are playing a pivotal role in enabling more resilient and adaptive grid operations.
Key players contributing to the competitive landscape in the Global Phasor Measurement Unit Market include Siemens, Powerside, STER (Studio Elektronike Rijeka) Ltd., Electric Power Group, GE Vernova, Valiant Communications, Schneider Electric, Schweitzer Engineering Laboratories, Inc., Hitachi, Qualitrol Corp, and Arbiter Systems. Key strategies adopted by companies in the phasor measurement unit market to strengthen their presence include a strong focus on innovation and collaboration. Leading players are investing in research and development to enhance PMU precision, cost efficiency, and integration with next-generation grid systems. Companies are also forming strategic alliances with utilities and technology firms to develop scalable software platforms and smart grid solutions. Many firms are expanding their geographic reach through partnerships and acquisitions, especially in rapidly developing markets.
Table of Contents
Chapter 1 Methodology & Scope
- 1.1 Market definitions
- 1.2 Base estimates & calculations
- 1.3 Forecast calculation
- 1.4 Data sources
- 1.4.1 Primary
- 1.4.2 Secondary
- 1.4.2.1 Paid
- 1.4.2.2 Public
Chapter 2 Executive Summary
- 2.1 Industry synopsis, 2021 – 2034
Chapter 3 Industry Insights
- 3.1 Industry ecosystem analysis
- 3.2 Regulatory landscape
- 3.3 Industry impact forces
- 3.3.1 Growth drivers
- 3.3.2 Industry pitfalls & challenges
- 3.4 Growth potential analysis
- 3.5 Porter's analysis
- 3.5.1 Bargaining power of suppliers
- 3.5.2 Bargaining power of buyers
- 3.5.3 Threat of new entrants
- 3.5.4 Threat of substitutes
- 3.6 PESTEL analysis
Chapter 4 Competitive landscape, 2024
- 4.1 Strategic dashboard
- 4.2 Innovation & sustainability landscape
Chapter 5 Market Size and Forecast, By Component, 2021 - 2034 (USD Million)
- 5.1 Key trends
- 5.2 Hardware
- 5.3 Software
Chapter 6 Market Size and Forecast, By Application, 2021 - 2034 (USD Million)
- 6.1 Key trends
- 6.2 Fault analysis
- 6.3 State estimation
- 6.4 Stability monitoring
- 6.5 Power system control
- 6.6 Operational monitoring
- 6.7 Grid visualization
- 6.8 Others
Chapter 7 Market Size and Forecast, By Region, 2021 - 2034 (USD Million)
- 7.1 Key trends
- 7.2 North America
- 7.2.1 U.S.
- 7.2.2 Canada
- 7.2.3 Mexico
- 7.3 Europe
- 7.3.1 UK
- 7.3.2 France
- 7.3.3 Germany
- 7.3.4 Italy
- 7.3.5 Russia
- 7.3.6 Spain
- 7.4 Asia Pacific
- 7.4.1 China
- 7.4.2 Australia
- 7.4.3 India
- 7.4.4 Japan
- 7.4.5 South Korea
- 7.5 Middle East & Africa
- 7.5.1 Saudi Arabia
- 7.5.2 UAE
- 7.5.3 Turkey
- 7.5.4 South Africa
- 7.5.5 Egypt
- 7.6 Latin America
- 7.6.1 Brazil
- 7.6.2 Argentina
Chapter 8 Company Profiles
- 8.1 Arbiter Systems
- 8.2 Electric Power Group
- 8.3 GE Vernova
- 8.4 Hitachi
- 8.5 Powerside
- 8.6 Qualitrol Corp
- 8.7 Schneider Electric
- 8.8 Schweitzer Engineering Laboratories, Inc.
- 8.9 Siemens
- 8.10 STER (Studio Elektronike Rijeka) Ltd.
- 8.11 Valiant Communications

