
PUBLISHER: Global Market Insights Inc. | PRODUCT CODE: 1782112

PUBLISHER: Global Market Insights Inc. | PRODUCT CODE: 1782112
Carbonation and Nitrogenation Systems Market Opportunity, Growth Drivers, Industry Trend Analysis, and Forecast 2025 - 2034
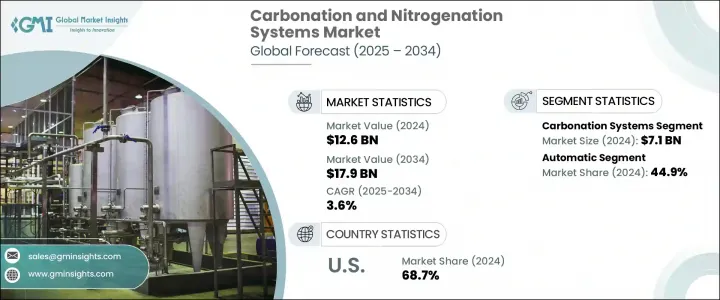
The Global Carbonation and Nitrogenation Systems Market was valued at USD 12.6 billion in 2024 and is estimated to grow at a CAGR of 3.6% to reach USD 17.9 billion by 2034. This market plays a crucial role in the food and beverage manufacturing ecosystem, where the demand for sparkling, carbonated, and nitrogen-infused beverages continues to accelerate. Consumers are increasingly drawn to drinks that offer unique sensory experiences, and gas infusion systems are at the core of delivering such quality. These systems are used across a broad spectrum of beverage categories-from everyday soft drinks to specialized wellness drinks-enhancing texture, taste, and shelf stability. Additionally, these systems are finding expanding utility across pharmaceutical manufacturing and other industrial applications, supporting processes that require gas-liquid mixing.
One of the key growth drivers behind this market is the shifting consumer inclination toward healthier and more premium beverage options, as well as the broader trend of urbanization and rising disposable incomes in emerging markets. As a result, manufacturers are under pressure to innovate rapidly and adapt to changing preferences, especially in densely populated regions where demand for ready-to-drink and on-the-go beverages is surging. Technology is playing a transformative role in meeting these expectations.
| Market Scope | |
|---|---|
| Start Year | 2024 |
| Forecast Year | 2025-2034 |
| Start Value | $12.6 Billion |
| Forecast Value | $17.9 Billion |
| CAGR | 3.6% |
Modern carbonation and nitrogenation equipment is no longer limited to basic functionality. Today's systems are increasingly automated, offering energy-efficient performance, reduced operational costs, and high scalability. Enhanced integration with digital control systems is further enabling producers to fine-tune gas infusion levels, resulting in better quality and consistency. As beverage innovation continues to evolve, gas-infused formulations with smoother mouthfeel and improved freshness are opening up new product possibilities, spurring the adoption of these advanced systems.
In terms of equipment type, the market is divided into carbonation and nitrogenation systems. The carbonation systems segment-which includes inline and batch carbonation technologies-held the largest share in 2024, generating USD 7.1 billion in revenue. This segment is seeing widespread use due to the continued global demand for carbonated beverages. Whether it's sparkling water, flavored health drinks, or other fizzy refreshments, the appeal of carbonated options remains strong. These systems function by introducing carbon dioxide into liquids, a process that has become increasingly refined with technological improvements that reduce gas loss, enhance energy conservation, and enable seamless integration into high-speed production lines.
Nitrogenation systems-comprising infusion, purging, and filling equipment-are also gaining traction, especially in formulations where texture and product differentiation are critical. However, carbonation systems continue to lead due to their broader application scope.
When segmented by automation level, the market is categorized into manual, semi-automatic, and automatic systems. In 2024, automatic systems emerged as the dominant category, accounting for 44.9% of the global market share with a value of USD 5.7 billion. These systems are engineered to perform complex gas infusion tasks with minimal human oversight. Featuring programmable logic controllers, advanced sensors, and user-friendly digital interfaces, automatic solutions allow precise control over dosing and pressure levels. This enhances not just product quality but also operational efficiency, reducing the need for manual adjustments and lowering labor costs. These features make automatic systems particularly attractive for both emerging startups and established beverage producers who seek flexibility and rapid product switching on their lines.
The scalability of these systems enables manufacturers to respond swiftly to market trends, especially in the premium beverage segment, where nitrogen-infused drinks are gaining popularity. Additionally, the drive for sustainability has prompted equipment makers to develop machines that consume less energy, produce less waste, and integrate easily into environmentally conscious production workflows.
Regionally, the United States accounted for a major portion of the North American market in 2024, contributing 68.7% of the regional share. This strong performance can be linked to significant investments in beverage processing infrastructure and rapid technological adoption. Automated solutions are becoming standard in U.S. facilities, where efficiency, product consistency, and adaptability are crucial to meeting consumer expectations. Furthermore, the emergence of niche beverage segments continues to fuel demand for systems capable of delivering enhanced mouthfeel and customized carbonation or nitrogenation profiles.
Leading companies in the carbonation and nitrogenation systems space are actively pursuing mergers, acquisitions, and strategic collaborations to expand their market presence and diversify product offerings. The industry is marked by intense competition, with major players, mid-sized manufacturers, and specialized startups all vying for market share through innovation, customization, and sustainable product development. While global firms bring high-tech integrated systems to the market, many regional providers focus on cost-effective, locally adapted solutions that meet specific production needs.
Table of Contents
Chapter 1 Methodology and Scope
- 1.1 Market scope and definition
- 1.2 Research design
- 1.2.1 Research approach
- 1.2.2 Data collection methods
- 1.3 Data mining sources
- 1.3.1 Global
- 1.3.2 Regional/Country
- 1.4 Base estimates and calculations
- 1.4.1 Base year calculation
- 1.4.2 Key trends for market estimation
- 1.5 Primary research and validation
- 1.5.1 Primary sources
- 1.6 Forecast model
- 1.7 Research assumptions and limitations
Chapter 2 Executive Summary
- 2.1 Industry 3600 synopsis
- 2.2 Key market trends
- 2.2.1 Regional
- 2.2.2 Equipment type
- 2.2.3 Automation level
- 2.2.4 Application
- 2.2.5 Distribution channel
- 2.3 CXO perspectives: Strategic imperatives
- 2.3.1 Key decision points for industry executives
- 2.3.2 Critical success factors for market players
- 2.4 Future outlook and strategic recommendations
Chapter 3 Industry Insights
- 3.1 Industry ecosystem analysis
- 3.1.1 Supplier landscape
- 3.1.2 Profit margin
- 3.1.3 Value addition at each stage
- 3.1.4 Factor affecting the value chain
- 3.2 Industry impact forces
- 3.2.1 Growth drivers
- 3.2.1.1 Growing demand for carbonated and nitrogenated beverages
- 3.2.1.2 Rising adoption in industrial and pharmaceutical applications
- 3.2.1.3 Technological advancements
- 3.2.2 Industry pitfalls & challenges
- 3.2.2.1 High capital and operating costs
- 3.2.2.2 Technological complexity
- 3.2.3 Opportunities
- 3.2.1 Growth drivers
- 3.3 Growth potential analysis
- 3.4 Future market trends
- 3.5 Technology and innovation landscape
- 3.5.1 Current technological trends
- 3.5.2 Emerging technologies
- 3.6 Price trends
- 3.6.1 By region
- 3.6.2 By type
- 3.7 Regulatory landscape
- 3.7.1 Standards and compliance requirements
- 3.7.2 Regional regulatory frameworks
- 3.7.3 Certification standards
- 3.8 Porter’s analysis
- 3.9 PESTEL analysis
Chapter 4 Competitive Landscape, 2024
- 4.1 Introduction
- 4.2 Company market share analysis
- 4.2.1 By region
- 4.2.1.1 North America
- 4.2.1.2 Europe
- 4.2.1.3 Asia Pacific
- 4.2.1.4 Latin America
- 4.2.1.5 MEA
- 4.2.1 By region
- 4.3 Company matrix analysis
- 4.4 Competitive analysis of major market players
- 4.5 Competitive positioning matrix
- 4.6 Key developments
- 4.6.1 Mergers & acquisitions
- 4.6.2 Partnerships & collaborations
- 4.6.3 New product launches
- 4.6.4 Expansion plans
Chapter 5 Market Estimates and Forecast, By Equipment Type, 2021 - 2034 (USD Billion) (Thousand Units)
- 5.1 Key trends
- 5.2 Carbonation systems
- 5.2.1 Inline carbonation systems
- 5.2.2 Batch carbonation systems
- 5.3 Nitrogenation systems
- 5.3.1 Infusion systems
- 5.3.2 Filling systems
- 5.3.3 Purging systems
- 5.3.4 Others
Chapter 6 Market Estimates and Forecast, By Automation Level, 2021 - 2034 (USD Billion) (Thousand Units)
- 6.1 Key trends
- 6.2 Manual
- 6.3 Semi-automatic
- 6.4 Automatic
Chapter 7 Market Estimates and Forecast, By Application, 2021 - 2034 (USD Billion) (Thousand Units)
- 7.1 Key trends
- 7.2 Food
- 7.3 Beverages
- 7.4 Pharmaceuticals
- 7.5 Chemicals
- 7.6 Others
Chapter 8 Market Estimates and Forecast, By Distribution Channel, 2021 - 2034 (USD Billion) (Thousand Units)
- 8.1 Key trends
- 8.2 Direct
- 8.3 Indirect
Chapter 9 Market Estimates and Forecast, By Region, 2021 - 2034 (USD Billion) (Thousand Units)
- 9.1 Key trends
- 9.2 North America
- 9.2.1 U.S.
- 9.2.2 Canada
- 9.3 Europe
- 9.3.1 Germany
- 9.3.2 UK
- 9.3.3 France
- 9.3.4 Spain
- 9.3.5 Italy
- 9.4 Asia Pacific
- 9.4.1 China
- 9.4.2 Japan
- 9.4.3 India
- 9.4.4 Australia
- 9.4.5 South Korea
- 9.5 Latin America
- 9.5.1 Brazil
- 9.5.2 Mexico
- 9.5.3 Argentina
- 9.6 Middle East and Africa
- 9.6.1 South Africa
- 9.6.2 Saudi Arabia
- 9.6.3 UAE
Chapter 10 Company Profiles
- 10.1 APV
- 10.2 Arol S.p.A.
- 10.3 Feldmeier Equipment Inc.
- 10.4 GEA Group
- 10.5 KHS GmbH
- 10.6 Krones AG
- 10.7 Linde Engineering
- 10.8 MBE Technology
- 10.9 NDC Technologies
- 10.10 Procomac
- 10.11 Schaefer Technologies Inc.
- 10.12 Sidel Group
- 10.13 Tenco Equipment Inc.
- 10.14 Tetra Pak
- 10.15 Zhejiang Shenghui Machinery Co., Ltd.

