
PUBLISHER: Global Market Insights Inc. | PRODUCT CODE: 1822596

PUBLISHER: Global Market Insights Inc. | PRODUCT CODE: 1822596
UV Sensors Market Opportunity, Growth Drivers, Industry Trend Analysis, and Forecast 2025 - 2034
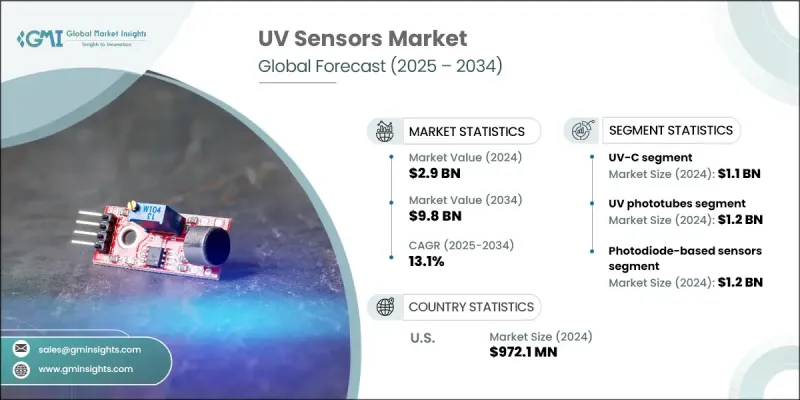
The Global UV Sensors Market was valued at USD 2.9 billion in 2024 and is estimated to grow at a CAGR of 13.1% to reach USD 9.8 billion by 2034.
This surge is driven by growing adoption of UV disinfection systems, increasing integration in smart wearables, widespread use in environmental and automotive monitoring, and expanding applications in healthcare and industrial sectors. Rising awareness of UV safety and environmental monitoring also fuels consistent demand for these sensors. Increasing usage of UV-based disinfection across sectors such as public utilities, healthcare settings, and commercial spaces continues to be a key catalyst. In hospitals and medical environments, demand for UV-C systems to sterilize surfaces, equipment, and air is pushing the requirement for accurate sensors. Moreover, industrial sectors are incorporating UV sensor solutions into process control, flame detection, and environmental compliance systems. A major trend shaping this space is the focus on producing compact, cost-effective UV sensors, which supports greater adoption in both industrial and consumer markets. The trend toward miniaturized components has improved flexibility in applications across safety systems, automation, and wearable technology.
| Market Scope | |
|---|---|
| Start Year | 2024 |
| Forecast Year | 2025-2034 |
| Start Value | $2.9 Billion |
| Forecast Value | $9.8 Billion |
| CAGR | 13.1% |
The UV-C segment generated USD 1.1 billion in 2024. It is expanding rapidly as demand grows for germicidal solutions in water treatment, healthcare, and municipal sanitation. UV-C sensors are essential for accurate dose measurement, irradiance control, and verifying disinfection performance. With safety regulations becoming more stringent, manufacturers are prioritizing the development of high-precision UV-C sensors that can operate consistently in rugged conditions and deliver traceable, reliable data for critical applications.
The UV phototubes segment was valued at USD 1.2 billion in 2024. These sensors are highly valued for their sensitivity and reliability in industrial environments, particularly in flame detection, combustion safety systems, and spectroscopic measurements. Their accuracy in high-risk environments makes them a go-to solution for monitoring UV emissions in both scientific and operational settings. Manufacturers in this segment are working toward enhancing the sensitivity and reliability of their phototube sensors while ensuring compliance with fire-safety regulations and industrial standards.
U.S. UV Sensors Market generated USD 972.1 million in 2024. Growth in the U.S. is supported by a strong regulatory landscape and continual innovations in UV-C technologies. Government regulations ensure that UV-related devices meet efficacy and safety standards, which has encouraged greater trust and adoption across sectors. The demand for UV sensors has grown in alignment with the increased deployment of UV disinfection systems and safety applications, especially in healthcare, environmental monitoring, and public infrastructure.
Prominent players in the Global UV Sensors Market include Silicon Laboratories Inc., Vishay Intertechnology Inc., Apogee Instruments Inc., Texas Instruments Inc., Analog Devices Inc., Broadcom Inc., Skye Instruments Ltd., STMicroelectronics N.V., Solar Light Co. Inc., Panasonic Holdings Corp., LAPIS Semiconductor Co. Ltd., Davis Instruments Corp., Genicom Co. Ltd., GaNo Optoelectronics Inc., and ams OSRAM AG. Companies in the UV sensors market are adopting a multi-pronged approach to reinforce their market presence. Many are investing in the development of highly accurate, NIST-traceable sensors designed to meet stringent regulatory demands in critical applications such as healthcare, environmental safety, and flame detection. Firms like Broadcom, Texas Instruments, and Apogee Instruments are expanding their product portfolios by integrating advanced features like wireless connectivity and real-time monitoring capabilities.
Table of Contents
Chapter 1 Methodology and scope
- 1.1 Market scope and definition
- 1.2 Research design
- 1.2.1 Research approach
- 1.2.2 Data collection methods
- 1.3 Data mining sources
- 1.3.1 Global
- 1.3.2 Regional/Country
- 1.4 Base estimates and calculations
- 1.4.1 Base year calculation
- 1.4.2 Key trends for market estimation
- 1.5 Primary research and validation
- 1.5.1 Primary sources
- 1.6 Forecast model
- 1.7 Research assumptions and limitations
Chapter 2 Executive summary
- 2.1 Industry 3600 synopsis
- 2.2 Key market trends
- 2.2.1 UV type trends
- 2.2.2 Type trends
- 2.2.3 Technology trends
- 2.2.4 end use application trends
- 2.2.5 Regional trends
- 2.3 TAM Analysis, 2025-2034 (USD Billion)
- 2.4 CXO perspectives: Strategic imperatives
- 2.4.1 Executive decision points
- 2.4.2 Critical success factors
- 2.5 Future outlook and strategic recommendations
Chapter 3 Industry insights
- 3.1 Industry ecosystem analysis
- 3.1.1 Supplier landscape
- 3.1.2 Profit margin
- 3.1.3 Cost structure
- 3.1.4 Value addition at each stage
- 3.1.5 Factor affecting the value chain
- 3.1.6 Disruptions
- 3.2 Industry ecosystem analysis
- 3.3 Industry impact forces
- 3.3.1 Growth drivers
- 3.3.1.1 Rising Demand for UV Disinfection
- 3.3.1.2 Growth in Wearable Technology
- 3.3.1.3 Automotive & Cabin Environmental Sensors
- 3.3.1.4 Growth in Healthcare Applications
- 3.3.1.5 Increasing deployment in industrial application
- 3.3.2 Pitfalls and challenges
- 3.3.2.1 High Costs of Advanced Sensors
- 3.3.2.2 Lack of Standardization & Variable Performance
- 3.3.1 Growth drivers
- 3.4 Growth potential analysis
- 3.5 Regulatory landscape
- 3.5.1 North America
- 3.5.2 Europe
- 3.5.3 Asia Pacific
- 3.5.4 Latin America
- 3.5.5 Middle East & Africa
- 3.6 Porter's analysis
- 3.7 PESTEL analysis
- 3.8 Technology and Innovation landscape
- 3.8.1 Current technological trends
- 3.8.2 Emerging technologies
- 3.9 Emerging Business Models
- 3.10 Compliance Requirements
- 3.11 Sustainability Measures
- 3.12 Patent and IP analysis
- 3.13 Geopolitical and trade dynamics
Chapter 4 Competitive landscape, 2024
- 4.1 Introduction
- 4.2 Company market share analysis
- 4.2.1 By region
- 4.2.1.1 North America
- 4.2.1.2 Europe
- 4.2.1.3 Asia Pacific
- 4.2.1.4 Latin America
- 4.2.1.5 Middle East & Africa
- 4.2.2 Market Concentration Analysis
- 4.2.1 By region
- 4.3 Competitive benchmarking of key players
- 4.3.1 Financial performance comparison
- 4.3.1.1 Revenue
- 4.3.1.2 Profit margin
- 4.3.1.3 R&D
- 4.3.2 Product portfolio comparison
- 4.3.2.1 Product range breadth
- 4.3.2.2 Technology
- 4.3.2.3 Innovation
- 4.3.3 Geographic presence comparison
- 4.3.3.1 Global footprint analysis
- 4.3.3.2 Service network coverage
- 4.3.3.3 Market penetration by region
- 4.3.4 Competitive positioning matrix
- 4.3.4.1 Leaders
- 4.3.4.2 Challengers
- 4.3.4.3 Followers
- 4.3.4.4 Niche players
- 4.3.5 Strategic outlook matrix
- 4.3.1 Financial performance comparison
- 4.4 Key developments, 2021-2024
- 4.4.1 Mergers and acquisitions
- 4.4.2 Partnerships and collaborations
- 4.4.3 Technological advancements
- 4.4.4 Expansion and investment strategies
- 4.4.5 Sustainability initiatives
- 4.4.6 Digital transformation initiatives
- 4.5 Emerging/ startup competitors landscape
Chapter 5 Market estimates and forecast, by Type, 2021 - 2034 (USD Million & Thousand Units)
- 5.1 Key trends
- 5.2 UV-A
- 5.3 UV-B
- 5.4 UV-C
- 5.5 Combined UV
Chapter 6 Market estimates and forecast, by UV Type, 2021 - 2034 (USD Million & Thousand Units)
- 6.1 Key trends
- 6.2 UV phototubes
- 6.3 Light sensors
- 6.4 UV spectrum sensors
Chapter 7 Market estimates and forecast, by Technology, 2021 - 2034 (USD Million & Thousand Units)
- 7.1 Key trends
- 7.2 Photodiode-based sensors
- 7.3 Phototransistor-based sensors
- 7.4 CMOS-based sensors
- 7.5 Others
Chapter 8 Market estimates and forecast, by End Use Application, 2021 - 2034 (USD Million & Thousand Units)
- 8.1 Key trends
- 8.2 Military & defense
- 8.2.1 Radiation exposure detection
- 8.2.2 Field decontamination systems
- 8.2.3 Others
- 8.3 Consumer electronics
- 8.3.1 Wearables
- 8.3.2 Smartphones and tablets
- 8.3.3 Smart home devices
- 8.3.4 Others
- 8.4 Healthcare and medical
- 8.4.1 UV disinfection and sterilization systems
- 8.4.2 Medical phototherapy devices
- 8.4.3 UV skin treatment
- 8.4.4 Others
- 8.5 Industrial
- 8.5.1 UV exposure detection
- 8.5.2 Machinery safety systems
- 8.5.3 Process control
- 8.5.4 Others
- 8.6 Automotive and transportation
- 8.6.1 In-cabin UV monitoring systems
- 8.6.2 Paint and interior material protection
- 8.6.3 Others
- 8.7 Agriculture and food industry
- 8.8 Environmental monitoring
- 8.9 Research and education
- 8.10 Others
Chapter 9 Market estimates and forecast, by Region, 2021 - 2034 (USD Million & Thousand Units)
- 9.1 Key trends
- 9.2 North America
- 9.2.1 U.S.
- 9.2.2 Canada
- 9.3 Europe
- 9.3.1 Germany
- 9.3.2 UK
- 9.3.3 France
- 9.3.4 Spain
- 9.3.5 Italy
- 9.3.6 Netherlands
- 9.4 Asia Pacific
- 9.4.1 China
- 9.4.2 India
- 9.4.3 Japan
- 9.4.4 Australia
- 9.4.5 South Korea
- 9.5 Latin America
- 9.5.1 Brazil
- 9.5.2 Mexico
- 9.5.3 Argentina
- 9.6 Middle East and Africa
- 9.6.1 Saudi Arabia
- 9.6.2 South Africa
- 9.6.3 UAE
Chapter 10 Company profiles
- 10.1 Global Key Players
- 10.1.1 Vishay Intertechnology Inc.
- 10.1.2 STMicroelectronics N.V.
- 10.1.3 ams OSRAM AG
- 10.2 Regional Key Players
- 10.2.1 North America
- 10.2.1.1 Silicon Laboratories Inc.
- 10.2.1.2 Texas Instruments Inc.
- 10.2.1.3 Apogee Instruments Inc.
- 10.2.2 Europe
- 10.2.2.1 Skye Instruments Ltd.
- 10.2.2.2 Analog Devices, Inc.
- 10.2.2.3 Solar Light Co. Inc.
- 10.2.3 Asia-Pacific
- 10.2.3.1 Panasonic Holdings Corp.
- 10.2.3.2 LAPIS Semiconductor Co. Ltd.
- 10.2.3.3 Genicom Co. Ltd.
- 10.2.1 North America
- 10.3 Disruptors / Niche Players
- 10.3.1 Broadcom Inc.
- 10.3.2 Davis Instruments Corp.
- 10.3.3 GaNo Optoelectronics Inc.

