
PUBLISHER: Global Market Insights Inc. | PRODUCT CODE: 1833444

PUBLISHER: Global Market Insights Inc. | PRODUCT CODE: 1833444
Wireless Display Market Opportunity, Growth Drivers, Industry Trend Analysis, and Forecast 2025 - 2034
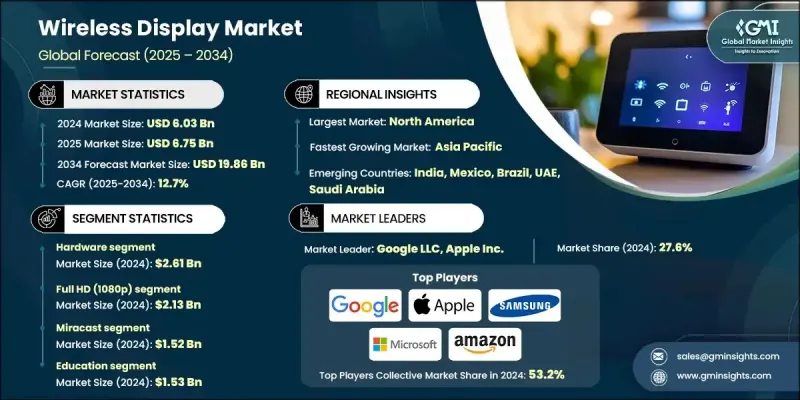
The Global Wireless Display Market was valued at USD 6.03 billion in 2024 and is estimated to grow at a CAGR of 12.7% to reach USD 19.86 billion by 2034.
This growth trajectory is driven by increasing adoption of smartphones and smart TVs, the widespread implementation of BYOD trends and hybrid work environments, the rapid scaling of online education models, and the rising use of wireless displays in both consumer and professional spaces. Continued progress in Wi-Fi 6/6E and 5G technologies is enhancing wireless connectivity, making screen casting and device interoperability faster and more reliable. The shift toward wireless communication within smart homes and workplaces underscores the growing demand for seamless, high-definition content sharing. Wireless display solutions support real-time collaboration and content distribution without the clutter of cables. Whether in boardrooms, classrooms, or households, the appeal lies in effortless connectivity, responsive performance, and compatibility across devices. This cross-sector adoption is fueling demand for wireless displays across North America, Asia-Pacific, and other growing digital ecosystems worldwide.
| Market Scope | |
|---|---|
| Start Year | 2024 |
| Forecast Year | 2025-2034 |
| Start Value | $6.03 billion |
| Forecast Value | $19.86 billion |
| CAGR | 12.7% |
In 2024, the hardware segment generated USD 2.61 billion. It continues to attract demand from businesses, educators, and consumers seeking intuitive, cable-free display solutions. Products such as casting dongles, adapters, display receivers, and integrated smart screens enable easy, high-quality screen mirroring across a variety of devices. These hardware tools support popular wireless protocols and standards, offering plug-and-play compatibility in workspaces, education settings, and entertainment systems.
The Full HD (1080p) resolution segment generated USD 2.13 billion in 2024. Full HD remains the most preferred resolution standard across a broad range of devices due to its ability to deliver crisp visuals with low latency while maintaining moderate bandwidth consumption. As demand increases for fluid screen-sharing and streaming in video calls, educational sessions, and entertainment applications, Full HD continues to meet user expectations with efficient performance. Its broad adoption in laptops, projectors, mobile devices, and TVs further strengthens its position in the wireless display landscape.
United States Wireless Display Market generated USD 1.62 billion in 2024 and is expected to grow at a CAGR of 13.2% through 2034. The rise in demand for wireless display solutions is closely tied to the surge in remote and hybrid work models and the widespread use of smart devices across households. The country's robust tech infrastructure has accelerated the adoption of cross-platform screen mirroring tools in both enterprise and consumer settings. As schools, corporations, and entertainment providers increase reliance on seamless, real-time display technologies, the U.S. market continues to play a pivotal role in shaping global trends.
Prominent companies operating in the wireless display market include LG Electronics Inc., Amazon.com, Inc., Barco NV, Apple Inc., Netgear Inc., ScreenBeam Inc., Sharp Corporation, BenQ Corporation, Intel Corporation, Google LLC, Samsung Electronics Co., Ltd., Dell Technologies Inc., Microsoft Corporation, and Airtame ApS. To enhance their market presence, wireless display companies are adopting strategies focused on cross-platform compatibility, integration, and innovation. Many leading firms are investing in R&D to launch products that support multiple wireless protocols like Miracast, AirPlay, and Chromecast, ensuring wide device interoperability. Expanding partnerships with OEMs and device manufacturers allows players to embed wireless display technologies directly into smart TVs, projectors, laptops, and mobile devices.
Table of Contents
Chapter 1 Methodology and Scope
- 1.1 Market scope and definition
- 1.2 Research design
- 1.2.1 Research approach
- 1.2.2 Data collection methods
- 1.3 Data mining sources
- 1.3.1 Global
- 1.3.2 Regional/Country
- 1.4 Base estimates and calculations
- 1.4.1 Base year calculation
- 1.4.2 Key trends for market estimation
- 1.5 Primary research and validation
- 1.5.1 Primary sources
- 1.6 Forecast model
- 1.7 Research assumptions and limitations
Chapter 2 Executive Summary
- 2.1 Industry 3600 synopsis
- 2.2 Key market trends
- 2.2.1. Component
- 2.2.2 Resolution
- 2.2.3 Technology
- 2.2.4 End Use Industry
- 2.2.5 North America
- 2.2.6 Europe
- 2.2.7 Asia Pacific
- 2.2.8 Latin America
- 2.2.9 Middle East & Africa
- 2.3 TAM Analysis, 2025-2034 (USD Million)
- 2.4 CXO perspective: Strategic imperatives
- 2.5 Executive decision points
- 2.6 Critical Success Factors
- 2.7 Future Outlook and Strategic Recommendations
Chapter 3 Industry Insights
- 3.1 Industry ecosystem analysis
- 3.1.1 Supplier Landscape
- 3.1.2 Profit Margin
- 3.1.3 Cost structure
- 3.1.4 Value addition at each stage
- 3.1.5 Factor affecting the value chain
- 3.1.6 Disruptions
- 3.2 Industry impact forces
- 3.2.1 Growth drivers
- 3.2.1.1 Surge in smart TV and smartphone adoption
- 3.2.1.2 Rising demand for BYOD and hybrid work models
- 3.2.1.3 Expansion of online learning and edtech platforms
- 3.2.1.4 Proliferation of streaming services and gaming platforms
- 3.2.1.5 Advancements in Wi-Fi 6/6e and 5G connectivity
- 3.2.2 Industry pitfalls and challenges
- 3.2.2.1 Interoperability and device compatibility issues
- 3.2.2.2 Latency, signal interference, and bandwidth limitations
- 3.2.3 Market Opportunities
- 3.2.3.1 Integration with unified communication platforms
- 3.2.3.2 Adoption in smart classrooms and digital learning
- 3.2.3.3 Expansion in automotive infotainment systems
- 3.2.3.4 Cloud-based wireless display for remote work
- 3.2.1 Growth drivers
- 3.3 Growth potential analysis
- 3.4 Regulatory landscape
- 3.4.1 North America
- 3.4.2 Europe
- 3.4.3 Asia Pacific
- 3.4.4 Latin America
- 3.4.5 Middle East & Africa
- 3.5 Porter’s analysis
- 3.6 PESTEL analysis
- 3.7 Technological and Innovation landscape
- 3.7.1 Current technological trends
- 3.7.2 Emerging technologies
- 3.8 Price Trends
- 3.8.1 By region
- 3.8.2 By product
- 3.9 Pricing strategies
- 3.10 Emerging business models
- 3.11 Compliance requirements
- 3.12 Sustainability measures
- 3.13 Consumer sentiment analysis
- 3.14 Patent and IP analysis
- 3.15 Geopolitical and trade dynamics
Chapter 4 Competitive Landscape, 2024
- 4.1 Introduction Company market share analysis
- 4.2 Company market share analysis
- 4.2.1 By region
- 4.2.1. North America
- 4.2.2. Europe
- 4.2.3. Asia Pacific
- 4.2.2 Market concentration analysis
- 4.3 Competitive Benchmarking of key Players
- 4.3.1 Financial Performance Comparison
- 4.3.1.1. Revenue
- 4.3.1.2. Profit Margin
- 4.3.1.3. R&D
- 4.3.2 Product Portfolio Comparison
- 4.3.2.1. Product Range Breadth
- 4.3.2.2. Technology
- 4.3.2.3. Innovation
- 4.3.3 Geographic Presence Comparison
- 4.3.3.1. Global Footprint Analysis
- 4.3.3.2. Service Network Coverage
- 4.3.3.3. Market Penetration by Region
- 4.3.4 Competitive Positioning Matrix
- 4.3.4.1. Leaders
- 4.3.4.2. Challengers
- 4.3.4.3. Followers
- 4.3.4.4. Niche Players
- 4.3.5 Strategic outlook matrix
- 4.3.1 Financial Performance Comparison
- 4.4 Key developments, 2021-2024
- 4.4.1 Mergers and Acquisitions
- 4.4.2 Partnerships and Collaborations
- 4.4.3 Technological Advancements
- 4.4.4 Expansion and Investment Strategies
- 4.4.5 Sustainability Initiatives
- 4.4.6 Digital Transformation Initiatives
- 4.5 Emerging/ Startup Competitors Landscape
Chapter 5 Market Estimates & Forecast, By Component, 2021 - 2034 (USD Billion & Units)
- 5.1 Key trends
- 5.2 Hardware
- 5.2.1 Display devices
- 5.2.1.1 Smart TVs
- 5.2.1.2 Monitors
- 5.2.1.3 Projectors
- 5.2.2 Wireless adapters
- 5.2.3 Transmission & communication modules
- 5.2.4 Antennas
- 5.2.5 Receivers
- 5.2.6 Repeaters
- 5.2.7 Others
- 5.2.1 Display devices
- 5.3 Software
- 5.3.1 Consumer-oriented software
- 5.3.2 Enterprise / collaboration software
- 5.3.3 Content management & media platforms
- 5.3.4 Security & device management software
- 5.3.5 Others
- 5.4 Services
- 5.4.1 Setup & installation
- 5.4.2 Maintenance & support
- 5.4.3 Cloud-based streaming
Chapter 6 Market estimates & forecast, By Resolution, 2021 - 2034 (USD Billion & Units)
- 6.1 Key trends
- 6.2 HD (720p)
- 6.3 Full HD (1080p)
- 6.4 4K Ultra HD
- 6.5 8K and Above
Chapter 7 Market estimates & forecast, By Technology, 2021 - 2034 (USD Billion & Units)
- 7.1 Key trends
- 7.2 WiDi (Intel Wireless Display)
- 7.3 Miracast
- 7.4 AirPlay
- 7.5 Google Cast (Chromecast)
- 7.6 Others
Chapter 8 Market Estimates and Forecast, By End Use Industry, 2021 - 2034 ( USD Billion & Units)
- 8.1 Key trends
- 8.2 Consumer electronics
- 8.2.1 Home entertainment
- 8.2.2 Gaming consoles & PCs
- 8.2.3 Smart speakers
- 8.2.4 Home automation
- 8.2.5 Others
- 8.3 Healthcare
- 8.3.1 Patient monitoring systems
- 8.3.2 Medical imaging display
- 8.3.3 Surgery & operation theaters
- 8.3.4 Training & e-learning
- 8.3.5 Others
- 8.4 Education
- 8.4.1 Online learning
- 8.4.2 Smart campuses
- 8.4.3 Interactive whiteboards & projectors
- 8.4.4 Educational content streaming
- 8.4.5 Others
- 8.5 Government & defense
- 8.5.1 Command & control centers
- 8.5.2 Public sector offices & administration
- 8.5.3 Surveillance & monitoring displays
- 8.5.4 Military training & simulation
- 8.5.5 Others
- 8.6 Media & entertainment
- 8.6.1 Broadcasting
- 8.6.2 Post-production & editing suites
- 8.6.3 Cinema & theater digital projection
- 8.6.4 Event & concert visual displays
- 8.6.5 Others
- 8.7 Retail
- 8.7.1 Digital signage & advertising
- 8.7.2 Interactive kiosks & in-store displays
- 8.7.3 Point of Sale (POS) systems
- 8.7.4 Others
- 8.8 Industrial / enterprise
- 8.8.1 Control rooms
- 8.8.2 Video conferencing
- 8.8.3 Factory floor monitoring
- 8.8.4 Training & onboarding displays
- 8.8.5 Others
- 8.9 Others
Chapter 9 Market Estimates and Forecast, By Region, 2021 - 2034 (USD Billion & Units)
- 9.1 Key trends
- 9.2 North America
- 9.2.1 U.S.
- 9.2.2 Canada
- 9.3 Europe
- 9.3.1 Germany
- 9.3.2 U.K.
- 9.3.3 France
- 9.3.4 Italy
- 9.3.5 Spain
- 9.3.6 Netherlands
- 9.3.7 Rest of Europe
- 9.4 Asia Pacific
- 9.4.1 China
- 9.4.2 India
- 9.4.3 Japan
- 9.4.4 South Korea
- 9.4.5 Australia
- 9.4.6 Rest of Asia Pacific
- 9.5 Latin America
- 9.5.1 Brazil
- 9.5.2 Mexico
- 9.5.3 Argentina
- 9.5.4 Rest of Latin America
- 9.6 Middle East & Africa
- 9.6.1 UAE
- 9.6.2 Saudi Arabia
- 9.6.3 South Africa
- 9.6.4 Rest of MEA
Chapter 10 Company Profile
- 10.1 Global Players:
- 10.1.1 Amazon.com, Inc.
- 10.1.2 Apple Inc.
- 10.1.3 Barco NV
- 10.1.4 Dell Technologies Inc.
- 10.1.5 Google LLC
- 10.1.6 HP Inc.
- 10.1.7 Intel Corporation
- 10.1.8 Lenovo Group Limited
- 10.1.9 LG Electronics Inc.
- 10.1.10 Microsoft Corporation
- 10.1.11 Panasonic Corporation
- 10.1.12 Samsung Electronics Co., Ltd.
- 10.1.13 Sharp Corporation
- 10.2 Regional Players:
- 10.2.1 Belkin International, Inc.
- 10.2.2 Epson America, Inc.
- 10.2.3 Netgear Inc.
- 10.2.4 Vanco International, LLC
- 10.3 Emerging Players:
- 10.3.1 Actiontec Electronics, Inc.
- 10.3.2 Airtame ApS
- 10.3.3 BenQ Corporation
- 10.3.4 ScreenBeam Inc.

