
PUBLISHER: Global Market Insights Inc. | PRODUCT CODE: 1844290

PUBLISHER: Global Market Insights Inc. | PRODUCT CODE: 1844290
Smart Dust Market Opportunity, Growth Drivers, Industry Trend Analysis, and Forecast 2025 - 2034
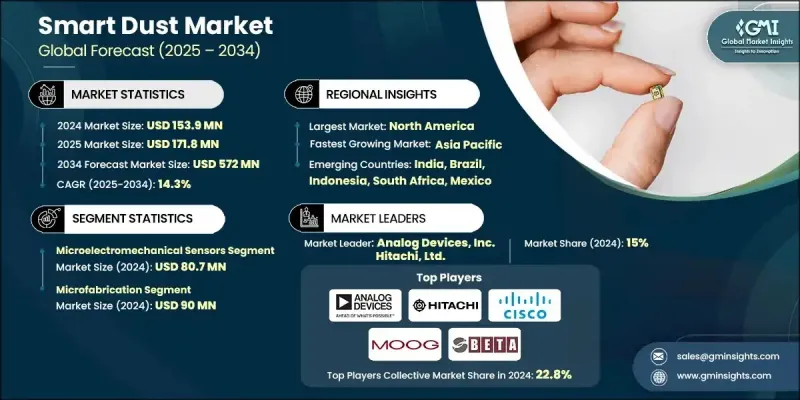
The Global Smart Dust Market was valued at USD 153.9 million in 2024 and is estimated to grow at a CAGR of 14.3% to reach USD 572 million by 2034.
The growth is owing to several key factors, including miniaturization of electronics and sensors, rising deployment in industrial IoT ecosystems, growing demand for environmental monitoring, breakthroughs in wireless communication technologies, and innovation in healthcare and biomedical applications. As sensor and electronics components continue to shrink in size, the capabilities of smart dust networks are expanding across multiple sectors. National-level investments in microelectronics are encouraging the production of ultra-compact sensing technologies. In the healthcare sector, investments in medical research are opening new possibilities for implantable and wearable micro-sensors. The introduction of artificial intelligence and machine learning within smart dust systems is a major development, enabling localized data processing and reducing reliance on continuous external communication. AI-powered smart dust can now carry out autonomous decision-making, perform real-time analytics, and detect operational anomalies. These features make smart dust especially suitable for time-sensitive applications across industrial automation, scientific research, and remote field operations where edge intelligence and ultra-low latency are critical.
| Market Scope | |
|---|---|
| Start Year | 2024 |
| Forecast Year | 2025-2034 |
| Start Value | $153.9 million |
| Forecast Value | $572 million |
| CAGR | 14.3% |
The microelectromechanical sensors (MEMS) segment generated USD 80.7 million in 2024. This segment continues to grow on the back of increased demand for compact, energy-saving sensors in defense applications such as navigation, targeting, and situational awareness. The adoption of MEMS in aerial and ground-based unmanned systems is enabling better environmental sensing and reliable communication under harsh conditions. For companies to remain competitive in this space, they need to develop defense-grade MEMS solutions with enhanced sensitivity, durability, and minimal energy consumption to meet stringent government standards and secure high-value defense contracts.
The microfabrication segment was valued at USD 90 million in 2024. With growing demand for miniaturized electronics and sensor-integrated defense equipment, microfabrication is driving advances in compact, high-precision systems. These improvements are enabling new capabilities in energy generation, soldier-wearable tech, and autonomous sensors. To meet industry expectations, manufacturers are investing in high-performance microfabrication technologies that are specifically engineered to withstand military environments while also meeting regulatory requirements.
U.S. Smart Dust Market was valued at USD 52.3 million in 2024, fueled by strategic defense programs investing in smart dust systems for real-time surveillance and battlefield analytics. The country is investing in smart dust platforms that can deliver critical data from dangerous or remote locations without endangering human lives. Manufacturers targeting the U.S. market must focus on developing secure, rugged, and highly scalable systems that are compatible with national defense infrastructure and built for demanding field conditions.
Major players in the Global Smart Dust Industry include Honeywell International Inc., Moog Inc., Intel Corporation, Bosch Sensortec GmbH, General Electric Company, Lightricity Ltd., Texas Instruments Inc., Qualcomm Technologies, Inc., Hitachi, Ltd., EnOcean GmbH, Smartdust Solutions Ltd., TE Connectivity Ltd., STMicroelectronics N.V., ARM Holdings plc, NXP Semiconductors N.V., BetaBatt, Inc., Cisco Systems, Inc., onsemi, ABB Ltd., Broadcom Inc., Sonardyne International Limited, Analog Devices, Inc., Stiftelsen for industriell og teknisk forskning (SINTEF), and International Business Machines Corporation. To build and maintain a competitive edge in the smart dust market, companies are prioritizing the development of ultra-low-power, compact sensor systems with embedded AI and real-time processing capabilities. They are investing in advanced microfabrication to produce defense-grade and medical-grade components tailored for high-performance environments. Strategic partnerships with government agencies, R&D institutions, and industry players are helping manufacturers gain access to new markets and secure long-term contracts.
Table of Contents
Chapter 1 Methodology and scope
- 1.1 Market scope and definition
- 1.2 Research design
- 1.2.1 Research approach
- 1.2.2 Data collection methods
- 1.3 Data mining sources
- 1.3.1 Global
- 1.3.2 Regional/Country
- 1.4 Base estimates and calculations
- 1.4.1 Base year calculation
- 1.4.2 Key trends for market estimation
- 1.5 Primary research and validation
- 1.5.1 Primary sources
- 1.6 Forecast model
- 1.7 Research assumptions and limitations
Chapter 2 Executive summary
- 2.1 Industry 3600 synopsis
- 2.2 Key market trends
- 2.2.1 Type trend
- 2.2.2 Component trends
- 2.2.3 Manufacturing process trends
- 2.2.4 End use application trends
- 2.2.5 Regional trends
- 2.3 TAM Analysis, 2025-2034 (USD Billion)
- 2.4 CXO perspectives: Strategic imperatives
- 2.4.1 Executive decision points
- 2.4.2 critical success factors
- 2.5 Future outlook and strategic recommendations
Chapter 3 Industry insights
- 3.1 Industry ecosystem analysis
- 3.1.1 Supplier landscape
- 3.1.2 Profit margin
- 3.1.3 Cost structure
- 3.1.4 Value addition at each stage
- 3.1.5 Factor affecting the value chain
- 3.1.6 Disruptions
- 3.2 Industry impact forces
- 3.2.1 Growth drivers
- 3.2.1.1 The miniaturization of sensors and electronics
- 3.2.1.2 Rising adoption in industrial IoT (IIoT)
- 3.2.1.3 Advancements in wireless communication protocols
- 3.2.1.4 Healthcare and biomedical innovations
- 3.2.1.5 The growing environmental monitoring needs
- 3.2.2 Pitfalls and challenges
- 3.2.2.1 High Implementation and Integration Costs
- 3.2.2.2 Data Security and Privacy Concerns
- 3.2.1 Growth drivers
- 3.3 Growth potential analysis
- 3.4 Regulatory landscape
- 3.4.1 North America
- 3.4.2 Europe
- 3.4.3 Asia Pacific
- 3.4.4 Latin America
- 3.4.5 Middle East & Africa
- 3.5 Porter’s analysis
- 3.6 PESTEL analysis
- 3.7 Technology and innovation landscape
- 3.7.1 Current technological trends
- 3.7.2 Emerging technologies
- 3.8 Emerging business models
- 3.9 Compliance requirements
- 3.10 Patent and IP analysis
- 3.11 Geopolitical and trade dynamics
Chapter 4 Competitive landscape, 2024
- 4.1 Introduction
- 4.2 Company market share analysis
- 4.2.1 By region
- 4.2.1.1 North America
- 4.2.1.2 Europe
- 4.2.1.3 Asia Pacific
- 4.2.1.4 Latin America
- 4.2.1.5 Middle East & Africa
- 4.2.2 Market Concentration Analysis
- 4.2.1 By region
- 4.3 Competitive benchmarking of key players
- 4.3.1 Financial performance comparison
- 4.3.1.1 Revenue
- 4.3.1.2 Profit margin
- 4.3.1.3 R&D
- 4.3.2 Product portfolio comparison
- 4.3.2.1 Product range breadth
- 4.3.2.2 Technology
- 4.3.2.3 Innovation
- 4.3.3 Geographic presence comparison
- 4.3.3.1 Global footprint analysis
- 4.3.3.2 Service network coverage
- 4.3.3.3 Market penetration by region
- 4.3.4 Competitive positioning matrix
- 4.3.4.1 Leaders
- 4.3.4.2 Challengers
- 4.3.4.3 Followers
- 4.3.4.4 Niche players
- 4.3.5 Strategic outlook matrix
- 4.3.1 Financial performance comparison
- 4.4 Key developments, 2021-2024
- 4.4.1 Mergers and acquisitions
- 4.4.2 Partnerships and collaborations
- 4.4.3 Technological advancements
- 4.4.4 Expansion and investment strategies
- 4.4.5 Sustainability initiatives
- 4.4.6 Digital transformation initiatives
- 4.5 Emerging/ startup competitors landscape
Chapter 5 Market estimates and forecast, by Type, 2021 - 2034 (USD Million)
- 5.1 Key trends
- 5.2 Microelectromechanical Sensors
- 5.3 Robots
- 5.4 Others
Chapter 6 Market estimates and forecast, by Component, 2021 - 2034 (USD Million)
- 6.1 Key trends
- 6.2 Sensors
- 6.3 Power supply units
- 6.4 Analog and digital I/O modules
- 6.5 Signal processing units
- 6.6 Control circuitry
- 6.7 Optical transmission modules
- 6.8 Radio frequency modules
- 6.9 Others
Chapter 7 Market estimates and forecast, by Manufacturing Process, 2021 - 2034 (USD Million)
- 7.1 Key trends
- 7.2 3D Printing
- 7.3 Microfabrication
Chapter 8 Market estimates and forecast, by End Use Application, 2021 - 2034 (USD Million)
- 8.1 Key trends
- 8.2 Military and defense
- 8.2.1 Surveillance and reconnaissance
- 8.2.2 Combat situational awareness
- 8.2.3 Border monitoring and tracking
- 8.2.4 Others
- 8.3 Healthcare and life sciences
- 8.3.1 Patient monitoring
- 8.3.2 Biomedical research
- 8.3.3 Others
- 8.4 Manufacturing and industrial
- 8.4.1 Process control automation
- 8.4.2 Predictive maintenance
- 8.4.3 Others
- 8.5 Telecommunications and IT
- 8.6 Energy and utilities
- 8.7 Agriculture
- 8.8 Aerospace and research institutions
- 8.9 Others
Chapter 9 Market estimates and forecast, by Region, 2021 - 2034 (USD Million)
- 9.1 Key trends
- 9.2 North America
- 9.2.1 U.S.
- 9.2.2 Canada
- 9.3 Europe
- 9.3.1 Germany
- 9.3.2 UK
- 9.3.3 France
- 9.3.4 Spain
- 9.3.5 Italy
- 9.3.6 Netherlands
- 9.4 Asia Pacific
- 9.4.1 China
- 9.4.2 India
- 9.4.3 Japan
- 9.4.4 Australia
- 9.4.5 South Korea
- 9.5 Latin America
- 9.5.1 Brazil
- 9.5.2 Mexico
- 9.5.3 Argentina
- 9.6 Middle East and Africa
- 9.6.1 Saudi Arabia
- 9.6.2 South Africa
- 9.6.3 UAE
Chapter 10 Company profiles
- 10.1 Global Key Players
- 10.1.1 Texas Instruments Inc.
- 10.1.2 IBM Corporation
- 10.1.3 Analog Devices, Inc.
- 10.1.4 Intel Corporation
- 10.1.5 Honeywell International Inc.
- 10.2 Regional Key Players
- 10.2.1 North America
- 10.2.1.1 Broadcom Inc.
- 10.2.1.2 Moog Inc.
- 10.2.1.3 BetaBatt, Inc..
- 10.2.2 Europe
- 10.2.2.1 STMicroelectronics N.V.
- 10.2.2.2 TE Connectivity Ltd.
- 10.2.2.3 EnOcean GmbH
- 10.2.2.4 SINTEF
- 10.2.3 Asia-Pacific
- 10.2.3.1 Hitachi, Ltd.
- 10.2.3.2 NXP Semiconductors N.V.
- 10.2.3.3 Bosch Sensortec GmbH
- 10.2.1 North America
- 10.3 Disruptors / Niche Players
- 10.3.1 ARM Holdings plc
- 10.3.2 Smartdust Solutions Ltd.
- 10.3.3 Lightricity Ltd.
- 10.3.4 CubeWorks, Inc.
- 10.3.5 Sonardyne International Limited
- 10.3.6 General Electric Company
- 10.3.7 Cisco Systems, Inc.
- 10.3.8 Onsemi

