
PUBLISHER: Global Market Insights Inc. | PRODUCT CODE: 1885810

PUBLISHER: Global Market Insights Inc. | PRODUCT CODE: 1885810
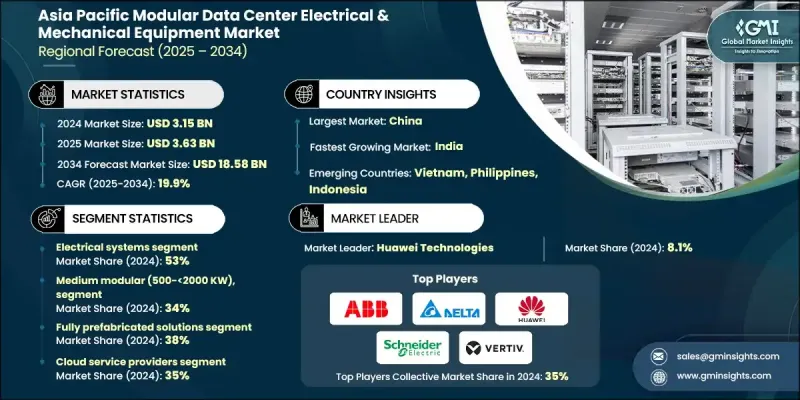
Asia Pacific Modular Data Center Electrical and Mechanical Equipment Market Opportunity, Growth Drivers, Industry Trend Analysis, and Forecast 2025 - 2034
Asia Pacific Modular Data Center Electrical & Mechanical Equipment Market was valued at USD 3.15 billion in 2024 and is estimated to grow at a CAGR of 19.9% to reach USD 18.58 billion by 2034.
Rapid expansion of AI and machine learning workloads across the region is prompting substantial investment in large-scale data center infrastructure. Hyperscale cloud operators are increasingly turning to modular platforms to support facilities requiring power capacities of 50-100 MW and to manage rack densities reaching 20-30 kW. These modular electrical and mechanical systems enable operators to expand capacity in phases, improving capital efficiency. China and India are emerging as major contributors to this shift, supported by surging data consumption and digitalization across finance, e-commerce, and telecommunications. The growing expectation that data centers must be operational within 6-9 months has pushed demand toward modular solutions, which speed deployment by enabling off-site manufacturing while site preparation occurs simultaneously. Scalable designs also allow data center developers to commission initial capacity and add more as utilization increases, reducing unnecessary investment and minimizing stranded assets.
| Market Scope | |
|---|---|
| Start Year | 2024 |
| Forecast Year | 2025-2034 |
| Start Value | $3.15 billion |
| Forecast Value | $18.58 billion |
| CAGR | 19.9% |
The electrical systems segment held a 53% share in 2024 and is projected to grow at a 20% CAGR through 2034. Electrical systems form the core of modular facilities by ensuring stable, efficient power delivery and continuous operation through redundant backup architecture. Rising rack densities and the shift toward advanced power distribution technologies are strengthening demand for modular UPS platforms, which represent the largest sub-segment. Intelligent PDUs, updated switchgear, and new-generation generator systems further support increasingly complex electrical topologies.
The small modular systems segment will grow at a 22.8% CAGR from 2025 to 2034. They are gaining traction among enterprise users, colocation operators, and distributed edge networks, particularly across tier-2 and tier-3 cities. Their integrated electrical and mechanical structures streamline deployment and enable completion within 3-6 months, making them appealing for scalable regional build-outs.
China Modular Data Center Electrical & Mechanical Equipment Market accounted for a 20% share in 2024, equating to USD 625.5 million. Growth in the country is driven by widespread internet usage, surging cloud adoption, and national digitalization programs. Strong demand from large cloud operators and policy measures encouraging data center development across interior regions continue to reinforce China's position as a major market force.
Leading companies active in the Asia Pacific Modular Data Center Electrical & Mechanical Equipment Market include Vertiv, Eaton Corporation, ABB, Huawei Technologies, Schneider Electric, General Electric Company, Delta Electronics, Siemens, Rittal, and Legrand. Companies competing in the Asia Pacific Modular Data Center Electrical & Mechanical Equipment Market are focusing on strategies that strengthen their regional presence and improve technological competitiveness. Many are expanding modular manufacturing capabilities and establishing localized production hubs to accelerate delivery schedules for operators with aggressive timelines. Firms are enhancing product portfolios by integrating high-efficiency power systems, advanced cooling technologies, and intelligent monitoring platforms to support dense AI-driven workloads. Strategic collaborations with cloud providers, colocation companies, and government-backed digital infrastructure programs help broaden market access.
Table of Contents
Chapter 1 Methodology
- 1.1 Market scope and definition
- 1.2 Research design
- 1.2.1 Research approach
- 1.2.2 Data collection methods
- 1.3 Data mining sources
- 1.3.1 Regional/Country
- 1.4 Base estimates and calculations
- 1.4.1 Base year calculation
- 1.4.2 Key trends for market estimation
- 1.5 Primary research and validation
- 1.5.1 Primary sources
- 1.6 Forecast model
- 1.7 Research assumptions and limitations
Chapter 2 Executive Summary
- 2.1 Industry 360° synopsis
- 2.2 Key market trends
- 2.2.1 Region
- 2.2.2 Equipment
- 2.2.3 Capacity range
- 2.2.4 Deployment model
- 2.2.5 End use
- 2.3 TAM analysis, 2025-2034
- 2.4 CXO perspectives: Strategic imperatives
- 2.4.1 Executive decision points
- 2.4.2 Critical success factors
- 2.5 Future outlook
- 2.6 Strategic recommendations
Chapter 3 Industry Insights
- 3.1 Industry ecosystem analysis
- 3.1.1 Supplier landscape
- 3.1.1.1 Tier 1: Global System Integrators & OEMs
- 3.1.1.2 Tier 2: specialized equipment manufacturer
- 3.1.1.3 Tier 3: component & material suppliers
- 3.1.1.4 Tier 4: raw material producers
- 3.1.2 Profit margin
- 3.1.2.1 Tier 1 Global OEM Margins
- 3.1.2.2 Systems integration premium analysis
- 3.1.2.3 Product segment margin differentiation
- 3.1.2.4 Detailed cost structure analysis
- 3.1.2.5 Battery systems detailed analysis
- 3.1.3 Cost structure
- 3.1.4 Value addition at each stage
- 3.1.5 Factor affecting the value chain
- 3.1.6 Disruptions
- 3.1.1 Supplier landscape
- 3.2 Industry impact forces
- 3.2.1 Growth drivers
- 3.2.1.1 Explosive AI workload growth driving power demand increase
- 3.2.1.2 Government sustainability mandates & energy efficiency requirements
- 3.2.1.3 Infrastructure constraints & grid limitations
- 3.2.1.4 Rapid edge computing expansion & 5G deployment
- 3.2.1.5 Cost optimization & faster time-to-market requirements
- 3.2.2 Industry pitfalls and challenges
- 3.2.2.1 High initial capital investment for modular solutions
- 3.2.2.2 Technical integration complexity & standardization challenges
- 3.2.3 Market opportunities
- 3.2.4 Immersion cooling technology adoption for high-density AI
- 3.2.5 Renewable energy integration & hybrid power systems
- 3.2.6 Edge-as-a-service & managed modular solutions
- 3.2.7 Retrofit & modernization of legacy data centers
- 3.2.1 Growth drivers
- 3.3 Growth potential analysis
- 3.4 Regulatory landscape
- 3.4.1 Asia Pacific
- 3.5 Porter's analysis
- 3.6 PESTEL analysis
- 3.7 Technology and innovation landscape
- 3.7.1 Current technological trends
- 3.7.1.1 Modular UPS systems with lithium-ion integration
- 3.7.1.2 Intelligent power distribution units (iPDUs)
- 3.7.1.3 Single-phase liquid cooling systems
- 3.7.1.4 Prefabricated modular data centers
- 3.7.1.5 AI-driven data center optimization
- 3.7.2 Emerging technologies
- 3.7.2.1 Two-phase immersion cooling
- 3.7.2.2 Quantum computing infrastructure
- 3.7.2.3 Advanced battery technologies (solid-state & sodium-metal chloride)
- 3.7.2.4 Edge-as-a-service modular solutions
- 3.7.2.5 Hybrid renewable power systems
- 3.7.3 Technology readiness & maturity assessment
- 3.7.1 Current technological trends
- 3.8 Price trends
- 3.8.1 By region
- 3.8.2 By product
- 3.9 Production statistics
- 3.9.1 Production hubs
- 3.9.2 Consumption hubs
- 3.9.3 Export and import
- 3.10 Cost breakdown analysis
- 3.10.1 Modular data center cost structure analysis
- 3.10.1.1 Modular-specific cost categories
- 3.10.1.2 Regional cost structure variations
- 3.10.2 Construction methodology comparison: cost per mw analysis
- 3.10.2.1 Modular/prefab vs. Traditional stick build pricing
- 3.10.2.1.1 Comprehensive cost per mw analysis
- 3.10.2.1.2 Deployment speed and schedule cost impact
- 3.10.2.1 Modular/prefab vs. Traditional stick build pricing
- 3.10.3 Build cost comparison (land costs excluded)
- 3.10.3.1 Detailed construction cost component analysis
- 3.10.3.2 Material and equipment cost optimization
- 3.10.4 Regional cost variations by methodology
- 3.10.4.1 Asia pacific regional construction cost analysis
- 3.10.4.2 Manufacturing location impact on methodology economics
- 3.10.5 Cost optimization strategies & best practices
- 3.10.5.1 Factory integration and standardization benefits
- 3.10.5.2 Manufacturing efficiency and quality control
- 3.10.5.3 Standardization strategies
- 3.10.5.4 Supply chain and procurement optimization
- 3.10.6 Energy efficiency and operational cost optimization
- 3.10.6.1 Power usage effectiveness (PUE) optimization
- 3.10.6.2 Lifecycle cost management and asset optimization
- 3.10.7 Financing options & investment models
- 3.10.7.1 Equipment-as-a-service and operational expenditure models
- 3.10.7.2 Subscription-based financing structures
- 3.10.7.3 Hybrid capital structures and risk allocation
- 3.10.8 Green financing and sustainability-linked investment models
- 3.10.8.1 Environmental performance-based financing
- 3.10.8.2 Power purchase agreements and energy infrastructure investment
- 3.10.1 Modular data center cost structure analysis
- 3.11 Patent analysis
- 3.11.1 Patent filing trends by technology
- 3.11.2 Innovation hotspots and IP concentration
- 3.11.3 Key patent holders and competitive positioning
- 3.11.4 Patent cliff analysis and market implications
- 3.11.5 Ip risk management and freedom to operate
- 3.11.6 Licensing, cross-licensing, and open innovation models
- 3.11.7 Regional patent landscape (Asia-Pacific focus)
- 3.12 Sustainability and environmental aspects
- 3.12.1 Sustainable practices
- 3.12.2 Waste reduction strategies
- 3.12.3 Energy efficiency in production
- 3.12.4 Eco-friendly initiatives
- 3.12.5 Carbon footprint considerations
- 3.13 Use Cases: Top 5 Applications for Modular Data Center Equipment
- 3.13.1 Hyperscale AI Data Center Expansion
- 3.13.2. Edge Computing for 5G and IoT
- 3.13.3 Financial services disaster recovery
- 3.13.4 Sustainable data center retrofits
- 3.13.5 Government and defense rapid deployment
- 3.14 Best-Case Scenarios: Top 5 Outcomes for Modular Data Center Equipment
- 3.14.1 AI-Optimized Green Campus
- 3.14.2. National 5G Edge Rollout
- 3.14.3 Disaster-Proof Financial DR Grid
- 3.14.4 Circular economy retrofit program
- 3.14.5 Rapid defense and emergency response
Chapter 4 Competitive Landscape, 2024
- 4.1 Introduction
- 4.2 Company market share analysis
- 4.2.1 China
- 4.2.2 India
- 4.2.3 Japan
- 4.2.4 South Korea
- 4.2.5 Australia
- 4.2.6 Southeast Asia
- 4.3 Competitive analysis of major market players
- 4.4 Competitive positioning matrix
- 4.5 Strategic outlook matrix
- 4.6 Key developments
- 4.6.1 Mergers & acquisitions
- 4.6.2 Partnerships & collaborations
- 4.6.3 New product launches
- 4.6.4 Expansion plans and funding
Chapter 5 Market Estimates & Forecast, By Equipment, 2021 - 2034 ($Mn, Units)
- 5.1 Key trends
- 5.2 Electrical systems
- 5.2.1 Modular UPS systems
- 5.2.2 Power distribution units (PDUs)
- 5.2.3 Switchgear & electrical infrastructure
- 5.2.4 Generators & backup power systems
- 5.3 Mechanical systems
- 5.3.1 Modular cooling solutions
- 5.3.2 Advanced thermal management systems
- 5.3.3 HVAC & environmental control systems
- 5.4 Control & monitoring systems
- 5.5 Structural & housing systems
Chapter 6 Market Estimates & Forecast, By Capacity Range, 2021 - 2034 ($Mn, Units)
- 6.1 Key trends
- 6.2 Micro modular (<100 KW)
- 6.3 Small modular (100-<500 KW)
- 6.4 Medium modular (500-<2000 KW)
- 6.5 Large modular (2000-<10000 KW)
- 6.6 Hyperscale modular (≥10000 KW)
Chapter 7 Market Estimates & Forecast, By Deployment Model, 2021 - 2034 ($Mn, Units)
- 7.1 Key trends
- 7.2 Fully prefabricated
- 7.3 Semi prefabricated
- 7.4 Modular component
- 7.5 Retrofit & modernization
Chapter 8 Market Estimates & Forecast, By End Use, 2021 - 2034 ($Mn, Units)
- 8.1 Key trends
- 8.2 Cloud service providers
- 8.3 Telecommunications & media
- 8.4 Financial services & insurance
- 8.5 Government & public sector
- 8.6 Healthcare & life sciences
- 8.7 Manufacturing & industrial
- 8.8 Energy & utilities
- 8.9 Retail & e-commerce
- 8.10 Transportation & logistics
- 8.11 Education & research
- 8.12 Real estate & construction
- 8.13 Others
Chapter 9 Market Estimates & Forecast, By Region, 2021 - 2034 ($Mn, Units)
- 9.1 Key trends
- 9.2 China
- 9.3 India
- 9.4 Japan
- 9.5 South Korea
- 9.6 Australia
- 9.7 Southeast Asia
- 9.7.1 Brunei
- 9.7.2 Cambodia
- 9.7.3 Indonesia
- 9.7.4 Laos
- 9.7.5 Malaysia
- 9.7.6 Myanmar
- 9.7.7 Philippines
- 9.7.8 Singapore
- 9.7.9 Thailand
- 9.7.10 Vietnam
- 9.8 Rest of APAC
Chapter 10 Company Profiles
- 10.1 Global companies
- 10.1.1 ABB
- 10.1.2 Eaton Corporation
- 10.1.3 GE Vernova
- 10.1.4 Legrand
- 10.1.5 Panduit
- 10.1.6 Rittal
- 10.1.7 Schneider Electric
- 10.1.8 Siemens
- 10.1.9 Stulz
- 10.1.10 Vertiv
- 10.2 Regional companies
- 10.2.1 Daikin Industries
- 10.2.2 Delta Electronics
- 10.2.3 Emerson Electric
- 10.2.4 Fuji Electric
- 10.2.5 Hitachi
- 10.2.6 Huawei Technologies
- 10.2.7 Mitsubishi Electric
- 10.2.8 nVent Electric
- 10.2.9 Panasonic Corporation
- 10.2.10 Toshiba
- 10.3 Emerging companies
- 10.3.1 Anhui Coolnet Data Power
- 10.3.2 Hefei Coolnet Power
- 10.3.3 NTT Data Corporation
- 10.3.4 QTS Data Centers
- 10.3.5 Shanghai Cooltech Power

