
PUBLISHER: Global Market Insights Inc. | PRODUCT CODE: 1885857

PUBLISHER: Global Market Insights Inc. | PRODUCT CODE: 1885857
Beverage Glass Recycling Market Opportunity, Growth Drivers, Industry Trend Analysis, and Forecast 2025 - 2034
The Global Beverage Glass Recycling Market was valued at USD 1.8 billion in 2024 and is estimated to grow at a CAGR of 6.7% to reach USD 3.5 billion by 2034.
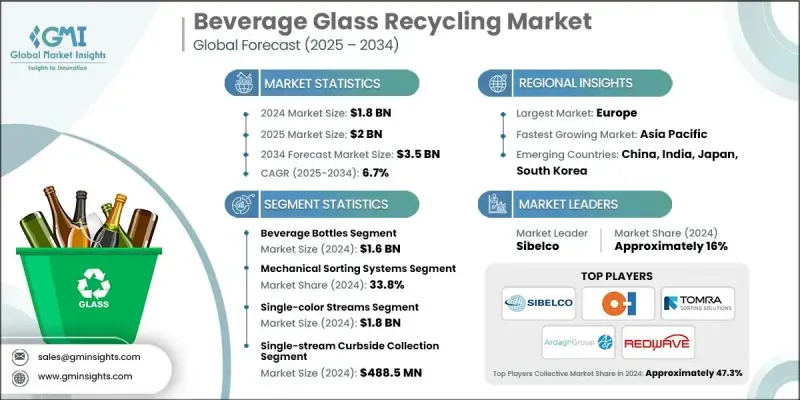
Beverage glass recycling has become a key component of circular economy frameworks, as it transforms post-consumer bottles and jars from alcoholic and non-alcoholic beverages into high-quality cullet through mechanical screening, optical sorting, and advanced cleaning technologies. This refined cullet maintains the performance characteristics of virgin glass, supporting its widespread use in manufacturing. Europe remains the leading region due to strong regulatory structures, high recovery rates, and established systems that ensure consistent input quality. North America shows solid growth despite variations in collection models, and new policy developments continue to enhance recovery efficiency. Meanwhile, the Asia Pacific region is expanding rapidly thanks to population density, rising demand from major brands, and government-backed sustainability measures. Regulatory advancements related to traceability and digital verification systems are shaping market structures by promoting transparency and incentivizing recyclers to improve data quality and ensure reliable recycled-content certification. Supportive funding mechanisms also strengthen long-term supply contracts between recycling operations and glass manufacturers.
| Market Scope | |
|---|---|
| Start Year | 2024 |
| Forecast Year | 2025-2034 |
| Start Value | $1.8 Billion |
| Forecast Value | $3.5 Billion |
| CAGR | 6.7% |
The mechanical sorting systems segment generated USD 622.5 million in 2024 and accounted for a 33.8% share. These systems remain dominant because they offer reliable performance, consistent throughput, and high separation accuracy. Their durable design, automated handling capabilities, and efficient screening processes make them particularly effective for large-scale operations managing high volumes of mixed materials, where consistent performance is essential.
The single-color streams segment accounted for USD 1.8 billion in 2024 and held a substantial share of 96%, with an expected CAGR of 6.6% from 2025 to 2034. These streams lead the color-separation segment due to the superior quality and processing ease they provide. Controlled color sorting improves melt efficiency, reduces contamination, and enhances the value of recycled glass, making this method ideal for premium manufacturing processes and closed-loop recycling applications that depend on uniform color and high purity.
North America Beverage Glass Recycling Market is projected to grow at a CAGR of 6.3% from 2025 to 2034. Increasing corporate commitments to sustainable packaging and broader adoption of circular strategies continue to push demand for high-quality recycled glass in beverages, food distribution, and premium packaging. Environmental concerns and the transition toward more advanced recycling infrastructure also support the long-term shift from virgin glass production to recycled alternatives.
Key companies active in the Global Beverage Glass Recycling Market include Sibelco, O-I (Owens-Illinois), TOMRA Sorting Solutions, Ardagh Group, REDWAVE, Sesotec GmbH, Reiling Group, SCHOTT AG, Visy Glass, Vetropack Group, Gallo Glass Company, Momentum Recycling, Mid America Recycling, and Ripple Glass. Companies in the Beverage Glass Recycling Market rely on several strategies to reinforce their competitiveness and expand market presence. Many are investing in cutting-edge optical sorting systems, real-time monitoring tools, and automated contamination detection to deliver higher-purity cullet. Strategic partnerships with beverage brands and container manufacturers help secure long-term supply contracts and stable revenue streams. Firms are also adopting digital tracking and data-integration technologies that support recycled-content verification and regulatory compliance.
Table of Contents
Chapter 1 Methodology & Scope
- 1.1 Market scope and definition
- 1.2 Research design
- 1.2.1 Research approach
- 1.2.2 Data collection methods
- 1.3 Data mining sources
- 1.3.1 Global
- 1.3.2 Regional/Country
- 1.4 Base estimates and calculations
- 1.4.1 Base year calculation
- 1.4.2 Key trends for market estimation
- 1.5 Primary research and validation
- 1.5.1 Primary sources
- 1.6 Forecast model
- 1.7 Research assumptions and limitations
Chapter 2 Executive Summary
- 2.1 Industry 360° synopsis
- 2.2 Key market trends
- 2.2.1 Container type
- 2.2.2 Processing technology type
- 2.2.3 Glass color
- 2.2.4 Collection system type
- 2.2.5 Regional trends
- 2.3 TAM Analysis, 2025-2034
- 2.4 CXO perspectives: Strategic imperatives
- 2.4.1 Executive decision points
- 2.4.2 Critical success factors
- 2.5 Future Outlook and Strategic Recommendations
Chapter 3 Industry Insights
- 3.1 Industry ecosystem analysis
- 3.1.1 Supplier landscape
- 3.1.2 Profit margin
- 3.1.3 Value addition at each stage
- 3.1.4 Factor affecting the value chain
- 3.1.5 Disruptions
- 3.2 Industry impact forces
- 3.2.1 Drivers
- 3.2.2 Pitfalls & Challenges
- 3.2.3 Opportunities
- 3.3 Growth potential analysis
- 3.4 Regulatory landscape
- 3.4.1 North America
- 3.4.2 Europe
- 3.4.3 Asia Pacific
- 3.4.4 Latin America
- 3.4.5 Middle East & Africa
- 3.5 Porter's analysis
- 3.6 PESTEL analysis
- 3.7 Price trends
- 3.7.1 By region
- 3.7.2 By container type
- 3.8 Future market trends
- 3.9 Technology and Innovation landscape
- 3.9.1 Current technological trends
- 3.9.2 Emerging technologies
- 3.10 Patent Landscape
- 3.11 Trade statistics (HS code) ( Note: the trade statistics will be provided for key countries only)
- 3.11.1 Major importing countries
- 3.11.2 Major exporting countries
- 3.12 Sustainability and environmental aspects
- 3.12.1 Sustainable practices
- 3.12.2 Waste reduction strategies
- 3.12.3 Energy efficiency in production
- 3.12.4 Eco-friendly initiatives
- 3.13 Carbon footprint consideration
Chapter 4 Competitive Landscape, 2024
- 4.1 Introduction
- 4.2 Company market share analysis
- 4.2.1 By region
- 4.2.1.1 North America
- 4.2.1.2 Europe
- 4.2.1.3 Asia Pacific
- 4.2.1.4 LATAM
- 4.2.1.5 MEA
- 4.2.1 By region
- 4.3 Company matrix analysis
- 4.4 Competitive analysis of major market players
- 4.5 Competitive positioning matrix
- 4.6 Key developments
- 4.6.1 Mergers & acquisitions
- 4.6.2 Partnerships & collaborations
- 4.6.3 New Product Launches
- 4.6.4 Expansion Plans
Chapter 5 Market Estimates and Forecast, By Container Type, 2021-2034 (USD Million & Kilo Tons)
- 5.1 Key trends
- 5.2 Beverage bottles
- 5.2.1 Beer bottles (brown, green, clear)
- 5.2.2 Wine bottles (bordeaux, burgundy, rhine styles)
- 5.2.3 Spirit & liquor bottles
- 5.2.4 Soft drink & water bottles
- 5.3 Beverage jars
- 5.3.1 Juice & smoothie jars
- 5.3.2 Specialty beverage containers
- 5.3.3 Mason jar style beverages
- 5.3.4 Wide-mouth container applications
Chapter 6 Market Estimates and Forecast, By Processing Technology Type, 2021-2034 (USD Million & Kilo Tons)
- 6.1 Key trends
- 6.2 Mechanical sorting systems
- 6.3 Optical sorting technology
- 6.4 Magnetic & eddy current separation
- 6.5 AI-based robotic sorting
- 6.6 Advanced cleaning & beneficiation systems
Chapter 7 Market Estimates and Forecast, By Glass Color, 2021-2034 (USD Million & Kilo Tons)
- 7.1 Key trends
- 7.2 Single-color streams
- 7.2.1 Flint/clear glass (95-100% purity)
- 7.2.2 Amber glass (90-100% purity)
- 7.2.3 Green glass (70-100% purity)
- 7.2.4 Specialty colors (blue, black, other)
- 7.3 Mixed-color streams
- 7.3.1 Two-color mixes
- 7.3.2 Three-color mixed (3-mix)
Chapter 8 Market Estimates and Forecast, By Collection System Type, 2021-2034 (USD Million & Kilo Tons)
- 8.1 Key trends
- 8.2 Single-stream curbside collection
- 8.3 Dual-stream curbside collection
- 8.4 Deposit return systems (DRS)
- 8.5 Drop-off centers & convenience programs
- 8.6 Commercial collection systems
Chapter 9 Market Estimates and Forecast, By Region, 2021-2034 (USD Million & Kilo Tons)
- 9.1 Key trends
- 9.2 North America
- 9.2.1 U.S.
- 9.2.2 Canada
- 9.3 Europe
- 9.3.1 Germany
- 9.3.2 UK
- 9.3.3 France
- 9.3.4 Spain
- 9.3.5 Italy
- 9.3.6 Rest of Europe
- 9.4 Asia Pacific
- 9.4.1 China
- 9.4.2 India
- 9.4.3 Japan
- 9.4.4 Australia
- 9.4.5 South Korea
- 9.4.6 Rest of Asia Pacific
- 9.5 Latin America
- 9.5.1 Brazil
- 9.5.2 Mexico
- 9.5.3 Argentina
- 9.5.4 Rest of Latin America
- 9.6 Middle East and Africa
- 9.6.1 Saudi Arabia
- 9.6.2 South Africa
- 9.6.3 UAE
- 9.6.4 Rest of Middle East and Africa
Chapter 10 Company Profiles
- 10.1 Sibelco
- 10.2 O-I (Owens-Illinois)
- 10.3 TOMRA Sorting Solutions
- 10.4 Ardagh Group
- 10.5 REDWAVE
- 10.6 Sesotec GmbH
- 10.7 Reiling Group
- 10.8 SCHOTT AG
- 10.9 Visy Glass
- 10.10 Vetropack Group
- 10.11 Gallo Glass Company
- 10.12 Momentum Recycling
- 10.13 Mid America Recycling
- 10.14 Ripple Glass

