
PUBLISHER: Global Market Insights Inc. | PRODUCT CODE: 1885865

PUBLISHER: Global Market Insights Inc. | PRODUCT CODE: 1885865
Clean Label Protein Hydrolysates Market Opportunity, Growth Drivers, Industry Trend Analysis, and Forecast 2025 - 2034
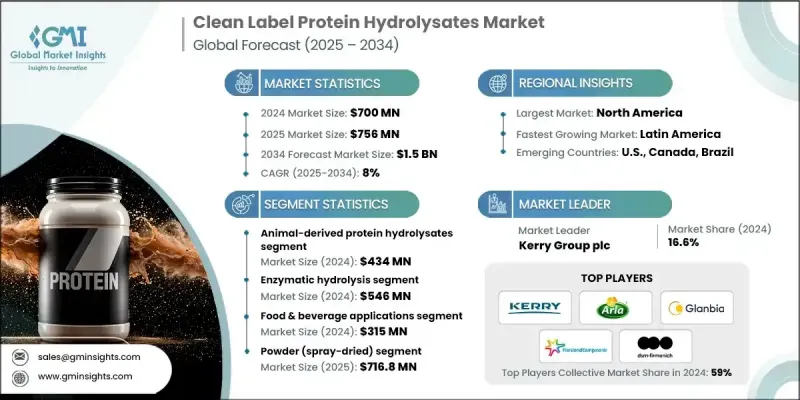
The Global Clean Label Protein Hydrolysates Market was valued at USD 700 million in 2024 and is estimated to grow at a CAGR of 8% to reach USD 1.5 billion by 2034.
Growth is accelerating as sports nutrition and performance-focused formulations gain mainstream traction, with consumers prioritizing fast-absorbing, easily digestible proteins that assist in muscle recovery and sustained energy. This shift is encouraging brands to reformulate beverages, snacks, and powdered supplements using enzyme-processed proteins to improve amino acid availability and digestive comfort. Clean-label expectations are reshaping procurement practices, as buyers prefer minimal processing, transparent sourcing, and recognizable ingredient lists. Enzyme-generated hydrolysates align well with these preferences due to their controlled processing, high functionality, and verified purity. Their expanding use extends into early-life nutrition, wellness beverages, and fortified foods. Clinical and therapeutic nutrition also represents a strong application area, supported by the exceptional digestibility and bioavailability of hydrolyzed proteins.
| Market Scope | |
|---|---|
| Start Year | 2024 |
| Forecast Year | 2025-2034 |
| Start Value | $700 Million |
| Forecast Value | $1.5 Billion |
| CAGR | 8% |
The enzymatic hydrolysis segment generated USD 546 million in 2024 and maintains a leading share due to its ability to produce clean, high-quality hydrolysates with precise peptide structures. This method optimizes digestibility, bioavailability, and sensory performance, making it suitable for infant nutrition, medical formulas, and high-performance supplements.
The powder (spray-dried) formats segment will grow at a CAGR of 7.8% through 2034. These powders dominate because of their long shelf life, stability, and ease of global transport. Their low moisture content and high concentration support large-scale production, enabling seamless integration into sports powders, infant nutrition, and clinical nutrition products.
North America Clean Label Protein Hydrolysates Market accounted for USD 224 million in 2024, representing a 32% share. The region's leadership is driven by the United States, supported by a well-developed sports nutrition industry, extensive clinical nutrition manufacturing capacity, and strong demand for infant formula and dietary supplements. High per-capita protein intake and a robust dairy and biotechnology ecosystem further reinforce regional expansion.
Major companies active in the Global Clean Label Protein Hydrolysates Market include Arla Foods Ingredients, Kerry Group plc, Glanbia Nutritionals, FrieslandCampina Ingredients, Archer Daniels Midland Company (ADM), Cargill, Incorporated, DSM-Firmenich, Norilia AS, Roquette Freres, Tate & Lyle PLC, Lactalis Ingredients, Peak Protein LLC, Nuritas, and AB Enzymes GmbH. Companies in the Global Clean Label Protein Hydrolysates Market are enhancing their competitive position through targeted investments in advanced enzymatic processing, high-purity ingredient development, and clean-label certification. Many firms are expanding production capacity to support global distribution while focusing on improving flavor, solubility, and digestibility through precise hydrolysis controls. Strategic partnerships with sports nutrition, infant formula, and medical nutrition manufacturers are helping create long-term supply and innovation pipelines. Businesses are also prioritizing transparent sourcing, traceability systems, and reduced additive use to align with evolving consumer expectations.
Table of Contents
Chapter 1 Methodology & Scope
- 1.1 Market scope and definition
- 1.2 Research design
- 1.2.1 Research approach
- 1.2.2 Data collection methods
- 1.3 Data mining sources
- 1.3.1 Global
- 1.3.2 Regional/Country
- 1.4 Base estimates and calculations
- 1.4.1 Base year calculation
- 1.4.2 Key trends for market estimation
- 1.5 Primary research and validation
- 1.5.1 Primary sources
- 1.6 Forecast model
- 1.7 Research assumptions and limitations
Chapter 2 Executive Summary
- 2.1 Industry 360° synopsis
- 2.2 Key market trends
- 2.2.1 Regional
- 2.2.2 Protein Source
- 2.2.3 Processing Method
- 2.2.4 Application
- 2.2.5 Form
- 2.3 TAM Analysis, 2025-2034
- 2.4 CXO perspectives: Strategic imperatives
- 2.4.1 Executive decision points
- 2.4.2 Critical success factors
- 2.5 Future Outlook and Strategic Recommendations
Chapter 3 Industry Insights
- 3.1 Industry ecosystem analysis
- 3.1.1 Supplier Landscape
- 3.1.2 Profit Margin
- 3.1.3 Value addition at each stage
- 3.1.4 Factor affecting the value chain
- 3.1.5 Disruptions
- 3.2 Industry impact forces
- 3.2.1 Growth drivers
- 3.2.1.1 Increasing sports nutrition & functional food consumption
- 3.2.1.2 Rising consumer demand for clean label products
- 3.2.1.3 Growth in clinical & medical nutrition applications
- 3.2.2 Industry pitfalls and challenges
- 3.2.2.1 High production costs of enzymatic hydrolysis
- 3.2.2.2 Complex regulatory compliance requirements
- 3.2.3 Market opportunities
- 3.2.3.1 Heat-stable hydrolysates for hot beverage applications
- 3.2.3.2 Organic & non-GMO certified hydrolysates
- 3.2.1 Growth drivers
- 3.3 Growth potential analysis
- 3.4 Regulatory landscape
- 3.4.1 North America
- 3.4.2 Europe
- 3.4.3 Asia Pacific
- 3.4.4 Latin America
- 3.4.5 Middle East & Africa
- 3.5 Porter's analysis
- 3.6 PESTEL analysis
- 3.7 Price trends
- 3.7.1 By region
- 3.7.2 Product
- 3.8 Future market trends
- 3.9 Technology and Innovation Landscape
- 3.9.1 Current technological trends
- 3.9.2 Emerging technologies
- 3.10 Patent Landscape
- 3.11 Trade statistics (HS code) (Note: the trade statistics will be provided for key countries only)
- 3.11.1 Major importing countries
- 3.11.2 Major exporting countries
- 3.12 Sustainability and environmental aspects
- 3.12.1 Sustainable practices
- 3.12.2 Waste reduction strategies
- 3.12.3 Energy efficiency in production
- 3.12.4 Eco-friendly initiatives
- 3.13 Carbon footprint considerations
Chapter 4 Competitive Landscape, 2024
- 4.1 Introduction
- 4.2 Company market share analysis
- 4.2.1 By region
- 4.2.1.1 North America
- 4.2.1.2 Europe
- 4.2.1.3 Asia Pacific
- 4.2.1.4 LATAM
- 4.2.1.5 MEA
- 4.2.1 By region
- 4.3 Company matrix analysis
- 4.4 Competitive analysis of major market players
- 4.5 Competitive positioning matrix
- 4.6 Key developments
- 4.6.1 Mergers & acquisitions
- 4.6.2 Partnerships & collaborations
- 4.6.3 New product launches
- 4.6.4 Expansion plans
Chapter 5 Market Estimates and Forecast, By Protein Source, 2021 - 2034 (USD Million) (Kilo Tons)
- 5.1 Key trends
- 5.2 Animal-derived protein hydrolysates
- 5.2.1 Dairy-based hydrolysates
- 5.2.1.1 Whey protein hydrolysates
- 5.2.1.2 Casein hydrolysates
- 5.2.1.3 Milk protein hydrolysates
- 5.2.2 Meat & poultry hydrolysates
- 5.2.2.1 Hydrolyzed poultry protein
- 5.2.2.2 Hydrolyzed beef & pork proteins
- 5.2.3 Marine-derived hydrolysates
- 5.2.4 Other animal sources
- 5.2.4.1 Collagen & gelatin hydrolysates
- 5.2.4.2 Egg protein hydrolysates
- 5.2.4.3 Blood protein hydrolysates
- 5.2.1 Dairy-based hydrolysates
- 5.3 Plant-Derived Protein Hydrolysates
- 5.3.1 Soy protein hydrolysates
- 5.3.2 Pea protein hydrolysates
- 5.3.3 Rice protein hydrolysates
- 5.3.4 Wheat protein hydrolysates
- 5.3.5 Corn protein hydrolysates
- 5.3.6 Other plant sources (fava bean, hemp, sorghum)
Chapter 6 Market Estimates and Forecast, By Processing Method, 2021 - 2034 (USD Million) (Kilo Tons)
- 6.1 Key trends
- 6.2 Enzymatic hydrolysis
- 6.3 Chemical hydrolysis (acid & alkaline)
- 6.4 Microbial fermentation
Chapter 7 Market Estimates and Forecast, By Application, 2021 - 2034 (USD Million) (Kilo Tons)
- 7.1 Key trends
- 7.2 Food & beverage applications
- 7.2.1 Sports nutrition & performance products
- 7.2.2 Infant nutrition & hypoallergenic formulas
- 7.2.3 Clinical & medical nutrition
- 7.2.4 Functional foods & beverages
- 7.2.5 Bakery & confectionery
- 7.2.6 Savory applications & flavor enhancement
- 7.2.7 Dairy products
- 7.3 Animal feed & nutrition
- 7.3.1 Aquaculture feed
- 7.3.2 Pet food
- 7.3.3 Livestock feed
- 7.4 Biopharmaceutical & cell culture
- 7.4.1 Mammalian cell culture media
- 7.4.2 Vaccine production
- 7.4.3 Monoclonal antibody manufacturing
- 7.5 Cosmetics & personal care
Chapter 8 Market Estimates and Forecast, By Form, 2021 - 2034 (USD Million) (Kilo Tons)
- 8.1 Key trends
- 8.2 Powder (spray-dried)
- 8.3 Liquid & concentrated paste
- 8.4 Semi-solid forms
Chapter 9 Market Estimates and Forecast, By Region, 2021 - 2034 (USD million) (Kilo Tons)
- 9.1 Key trends
- 9.2 North America
- 9.2.1 U.S.
- 9.2.2 Canada
- 9.3 Europe
- 9.3.1 Germany
- 9.3.2 UK
- 9.3.3 France
- 9.3.4 Spain
- 9.3.5 Italy
- 9.3.6 Rest of Europe
- 9.4 Asia Pacific
- 9.4.1 China
- 9.4.2 India
- 9.4.3 Japan
- 9.4.4 Australia
- 9.4.5 South Korea
- 9.4.6 Rest of Asia Pacific
- 9.5 Latin America
- 9.5.1 Brazil
- 9.5.2 Mexico
- 9.5.3 Rest of Latin America
- 9.6 Middle East and Africa
- 9.6.1 Saudi Arabia
- 9.6.2 South Africa
- 9.6.3 UAE
- 9.6.4 Rest of Middle East and Africa
Chapter 10 Company Profiles
- 10.1 Arla Foods Ingredients
- 10.2 Kerry Group plc
- 10.3 Glanbia Nutritionals
- 10.4 FrieslandCampina Ingredients
- 10.5 Archer Daniels Midland Company (ADM)
- 10.6 Cargill, Incorporated
- 10.7 DSM-Firmenich
- 10.8 Norilia AS
- 10.9 Roquette Freres
- 10.10 Tate & Lyle PLC
- 10.11 Lactalis Ingredients
- 10.12 Peak Protein LLC
- 10.13 Nuritas
- 10.14 AB Enzymes GmbH

