
PUBLISHER: Global Market Insights Inc. | PRODUCT CODE: 1892646

PUBLISHER: Global Market Insights Inc. | PRODUCT CODE: 1892646
Mobility Data Analytics Platforms Market Opportunity, Growth Drivers, Industry Trend Analysis, and Forecast 2025 - 2034
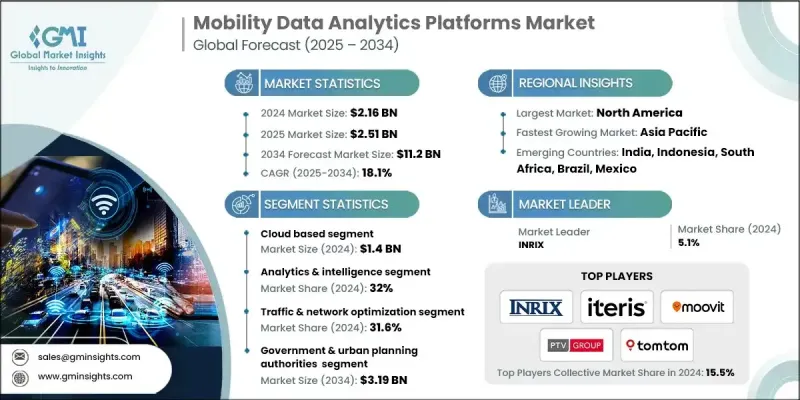
The Global Mobility Data Analytics Platforms Market was valued at USD 2.16 billion in 2024 and is estimated to grow at a CAGR of 18.1% to reach USD 11.2 billion by 2034.
The market is accelerating as organizations focus on real-time multi-modal mobility intelligence, which supports continuous oversight of traffic, transit, freight, and micro-mobility systems. This capability strengthens day-to-day decision-making, enables adaptive signal adjustments, enhances response times during network disruptions, and elevates traveler information quality. Together, these advantages help reduce congestion, improve service reliability, support safer movement across networks, and boost overall operational performance. AI-driven forecasting paired with mobility digital twins is also reshaping long-term planning. These tools offer deeper visibility into emerging travel patterns, potential congestion points, and infrastructure readiness, allowing stakeholders to test scenarios, guide strategic investment, and address system risks in advance. With the rapid rise of connected vehicles, IoT endpoints, and advanced sensing technologies, data volumes and precision are increasing at a dramatic pace. As datasets become richer, mobility analytics deliver stronger real-time risk detection, support predictive maintenance activities, strengthen multimodal coordination, expand smart city capabilities, enrich user experience, and quicken the rollout of intelligent and autonomous mobility innovations.
| Market Scope | |
|---|---|
| Start Year | 2024 |
| Forecast Year | 2025-2034 |
| Start Value | $2.16 Billion |
| Forecast Value | $11.2 Billion |
| CAGR | 18.1% |
The cloud-based platforms generated USD 1.4 billion in 2024 and are predicted to grow at an 18.9% CAGR through 2034. Their momentum is driven by demand for scalable infrastructure, lower upfront investment, and immediate access to modern AI tools. These cloud environments also allow fast implementation and remote accessibility under software-as-a-service or platform-as-a-service models, reducing financial exposure. Adoption has been strong among organizations that do not have the resources to maintain on-site systems or high-performance computing environments.
The analytics and intelligence segment represented a 32% share in 2024 and is expected to grow at a CAGR of 21.2% from 2025 to 2034. Growth in this category is tied to the surge in connected vehicle technologies, telematics, and IoT-driven data creation. New real-time data pipelines and streaming architectures are enabling faster and more accurate data collection, supporting immediate operational insights across traffic oversight, fleet optimization, transit planning, predictive modeling, and urban mobility management.
United States Mobility Data Analytics Platforms Market accounted for 87% share in 2024. The U.S. market generated USD 641.8 million that year and is positioned for strong expansion through 2034. Accelerated adoption of real-time traffic systems and vehicle-to-everything communication is strengthening links between vehicles, infrastructure, and edge-based analytics. These advancements support quicker responses to roadway events, help refine adaptive signal operations, and reinforce connected safety services. The result is rising investment in low-latency platforms and collaborative public-private deployments across road networks and mobility programs, all of which encourage broader use of cloud-native operational analytics.
Key companies active in the Mobility Data Analytics Platforms Market include Teralytics, HERE Technologies, TomTom, Streetlight Data, Cubic Transportation Systems, Iteris, Siemens Mobility, PTV Planung Transport Verkehr, Moovit, and INRIX. Companies competing in the mobility data analytics platforms market are reinforcing their market position by expanding AI-driven analytics capabilities, strengthening cloud-native architectures, and integrating advanced modeling tools that support real-time and predictive insights. Many firms are focusing on partnerships with public agencies, technology providers, and automotive stakeholders to broaden data access and enhance platform interoperability. Investment in scalable APIs and flexible deployment models is helping vendors meet diverse customer needs while keeping operating costs low. Organizations are also prioritizing continuous updates in machine learning, digital twin simulation, and multimodal analytics to differentiate their offerings.
Table of Contents
Chapter 1 Methodology
- 1.1 Market scope and definition
- 1.2 Research design
- 1.2.1 Research approach
- 1.2.2 Data collection methods
- 1.3 Data mining sources
- 1.3.1 Global
- 1.3.2 Regional/Country
- 1.4 Base estimates and calculations
- 1.4.1 Base year calculation
- 1.4.2 Key trends for market estimation
- 1.5 Primary research and validation
- 1.5.1 Primary sources
- 1.6 Forecast
- 1.7 Research assumptions and limitations
Chapter 2 Executive Summary
- 2.1 Industry 360° synopsis, 2021 - 2034
- 2.2 Key market trends
- 2.2.1 Deployment
- 2.2.2 Technology
- 2.2.3 Application
- 2.2.4 End Use
- 2.2.5 Regional
- 2.3 TAM Analysis, 2026-2034
- 2.4 CXO perspectives: Strategic imperatives
- 2.4.1 Executive decision points
- 2.4.2 Critical success factors
- 2.5 Future outlook & strategic recommendations
Chapter 3 Industry Insights
- 3.1 Industry ecosystem analysis
- 3.1.1 Supplier landscape
- 3.1.2 Profit margin analysis
- 3.1.3 Cost structure
- 3.1.4 Value addition at each stage
- 3.1.5 Factor affecting the value chain
- 3.1.6 Disruptions
- 3.2 Industry impact forces
- 3.2.1 Growth drivers
- 3.2.1.1 Urban congestion and population growth
- 3.2.1.2 Expansion of smart city and its investments
- 3.2.1.3 Surge in connected vehicles and IoT devices
- 3.2.1.4 Growth of public transit digitization
- 3.2.1.5 Corporate demand for fleet and logistics optimization
- 3.2.2 Industry pitfalls and challenges
- 3.2.2.1 Data privacy and security concerns
- 3.2.2.2 High integration and deployment costs
- 3.2.3 Market opportunities
- 3.2.3.1 Growth of autonomous and advanced driver assistance systems (ADAS)
- 3.2.3.2 Expansion of EV infrastructure and charging analytics
- 3.2.3.3 Sustainable mobility and emissions monitoring
- 3.2.3.4 Integration of multimodal mobility-as-a-service (MaaS)
- 3.2.1 Growth drivers
- 3.3 Growth potential analysis
- 3.4 Regulatory landscape
- 3.4.1 North America
- 3.4.2 Europe
- 3.4.3 Asia Pacific
- 3.4.4 Latin America
- 3.4.5 Middle east and Africa
- 3.5 Porter's analysis
- 3.6 PESTEL analysis
- 3.7 Technology and Innovation landscape
- 3.7.1 Current technology
- 3.7.2 Emerging technology
- 3.8 Patent analysis
- 3.9 Future market trends
- 3.10 Major market trends and disruptions
- 3.11 Customer Adoption & Satisfaction Analytics
- 3.11.1 Adoption Rates by Industry Segment
- 3.11.2 User Satisfaction Metrics & NPS Scores
- 3.11.3 Feature Utilization Patterns
- 3.11.4 Churn Rates & Retention Analysis
- 3.11.5 Customer Success Factors
- 3.12 Data Quality & Integration Challenges
- 3.12.1 Data Completeness & Accuracy Issues
- 3.12.2 Real-Time Data Latency Constraints
- 3.12.3 Multi-Source Data Integration Complexity
- 3.12.4 Legacy System Compatibility
- 3.12.5 Data Standardization Barriers
- 3.12.6 Sensor Calibration & Maintenance Requirements
- 3.13 ROI & Business Value Quantification
- 3.13.1 Cost Savings Metrics by Application
- 3.13.2 Operational Efficiency Improvements
- 3.13.3 Safety & Risk Reduction Benefits
- 3.13.4 Revenue Generation Opportunities
- 3.13.5 Total Cost of Ownership Analysis
- 3.13.6 Payback Period Benchmarks
- 3.14 Industry Maturity Assessment & Implementation Benchmarks
- 3.14.1 Maturity Model Framework
- 3.14.2 Capability Maturity by Industry Segment
- 3.14.3 Technology Adoption Lifecycle Stage
- 3.14.4 Implementation Timeline Benchmarks
- 3.14.5 Resource Requirements & Staffing Models
- 3.14.6 Organizational Readiness Assessment
- 3.15 Use Case Development & Implementation Roadmaps
- 3.15.1 Use Case Prioritization Framework
- 3.15.2 Proof-of-Concept to Production Pathway
- 3.15.3 Phased Implementation Strategies
- 3.15.4 Quick Wins vs Long-Term Initiatives
- 3.15.5 Stakeholder Engagement & Change Management
- 3.15.6 Training & Capacity Building Programs
- 3.16 Real-World Case Studies & Implementation Outcomes
- 3.16.1 Fleet Management Deployments
- 3.16.2 Smart City Traffic Management Projects
- 3.16.3 Public Transit Optimization Initiatives
- 3.16.4 Shared Mobility Platform Implementations
- 3.16.5 Smart Parking System Rollouts
- 3.16.6 Lessons Learned & Best Practices
- 3.17 Integration & Interoperability Landscape
- 3.17.1 API Standards & Protocols
- 3.17.2 Data Exchange Formats & Specifications
- 3.17.3 Multi-Vendor Integration Patterns
- 3.17.4 Cloud Platform Compatibility
- 3.17.5 Open Source vs Proprietary Solutions
- 3.17.6 Cross-Border Data Sharing Mechanisms
- 3.18 Cybersecurity, Data Privacy & Compliance Architecture
- 3.18.1 Threat Landscape & Attack Vectors
- 3.18.2 NIST Cybersecurity Framework Application
- 3.18.3 Privacy-by-Design Implementation
- 3.18.4 Data Anonymization & De-Identification
- 3.18.5 Compliance Certification Requirements
- 3.18.6 Incident Response & Recovery Protocols
- 3.18.7 Third-Party Risk Management
Chapter 4 Competitive Landscape, 2024
- 4.1 Introduction
- 4.2 Company market share analysis
- 4.2.1 North America
- 4.2.2 Europe
- 4.2.3 Asia Pacific
- 4.2.4 LATAM
- 4.2.5 MEA
- 4.3 Competitive analysis of major market players
- 4.4 Competitive positioning matrix
- 4.5 Strategic outlook matrix
- 4.6 Key news and initiatives
- 4.6.1 Mergers & acquisitions
- 4.6.2 Partnerships & collaborations
- 4.6.3 New Product Launches
- 4.6.4 Expansion Plans and funding
Chapter 5 Market Estimates & Forecast, By Deployment, 2021 - 2034 ($Mn)
- 5.1 Key trends
- 5.2 Cloud-based
- 5.3 On-premises
- 5.4 Hybrid
Chapter 6 Market Estimates & Forecast, By Technology, 2021 - 2034 ($Mn)
- 6.1 Key trends
- 6.2 Data collection & telemetry
- 6.3 Data management & storage
- 6.4 Analytics & intelligence
- 6.5 Visualization & user interface
- 6.6 Connectivity & integration
Chapter 7 Market Estimates & Forecast, By Application, 2021 - 2034 ($Mn)
- 7.1 Key trends
- 7.2 Traffic & network optimization
- 7.3 Fleet & asset management
- 7.4 Public transit & shared mobility analytics
- 7.5 Safety, compliance & incident management
- 7.6 Revenue, pricing & demand forecasting
- 7.7 Sustainability, emissions & environmental monitoring
Chapter 8 Market Estimates & Forecast, By End Use, 2021 - 2034 ($Mn)
- 8.1 Key trends
- 8.2 Government & urban planning authorities
- 8.3 Public transportation agencies
- 8.4 Mobility & shared transport operators
- 8.5 Logistics & fleet-based enterprises
- 8.6 Automotive OEMs & tier-1 tech providers
- 8.7 Research, policy & academic institutions
Chapter 9 Market Estimates & Forecast, By Region, 2021 - 2034 ($Mn)
- 9.1 Key trends
- 9.2 North America
- 9.2.1 US
- 9.2.2 Canada
- 9.3 Europe
- 9.3.1 Germany
- 9.3.2 UK
- 9.3.3 France
- 9.3.4 Italy
- 9.3.5 Spain
- 9.3.6 Nordics
- 9.3.7 Netherlands
- 9.3.8 Russia
- 9.3.9 BENELUX
- 9.4 Asia Pacific
- 9.4.1 China
- 9.4.2 India
- 9.4.3 Japan
- 9.4.4 ANZ
- 9.4.5 Singapore
- 9.4.6 Thailand
- 9.4.7 Vietnam
- 9.4.8 South Korea
- 9.5 Latin America
- 9.5.1 Brazil
- 9.5.2 Mexico
- 9.5.3 Argentina
- 9.6 MEA
- 9.6.1 South Africa
- 9.6.2 Saudi Arabia
- 9.6.3 UAE
Chapter 10 Company Profiles
- 10.1 Global Players
- 10.1.1 Geotab
- 10.1.2 INRIX
- 10.1.3 Mapbox
- 10.1.4 Omnitracs
- 10.1.5 PTV Planung Transport Verkehr
- 10.1.6 Samsara
- 10.1.7 Siemens Mobility
- 10.1.8 Teledyne FLIR / Acyclica
- 10.1.9 Trimble Transportation
- 10.1.10 Verizon Connect
- 10.1.11 HERE Technologies
- 10.1.12 Iteris
- 10.1.13 Teralytics
- 10.1.14 TomTom
- 10.2 Regional Champions
- 10.2.1 Cubic Transportation Systems
- 10.2.2 CVEDIA
- 10.2.3 Econolite
- 10.2.4 FLASH (Park Assist)
- 10.2.5 Kapsch TrafficCom
- 10.2.6 ParkMobile
- 10.2.7 Powerfleet
- 10.2.8 Remix (Via)
- 10.2.9 SWARCO
- 10.2.10 Swiftly
- 10.2.11 Teletrac Navman
- 10.3 Emerging Players & Disruptors
- 10.3.1 ATOM Mobility
- 10.3.2 Descartes Systems
- 10.3.3 FourKites
- 10.3.4 LVL Parking
- 10.3.5 Moovit (Intel)
- 10.3.6 Populus
- 10.3.7 Ride Report
- 10.3.8 StreetLight Data

