
PUBLISHER: Global Market Insights Inc. | PRODUCT CODE: 1892761

PUBLISHER: Global Market Insights Inc. | PRODUCT CODE: 1892761
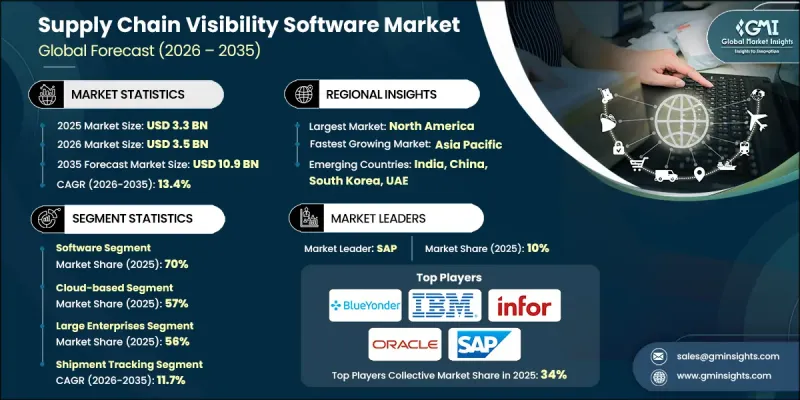
Supply Chain Visibility Software Market Opportunity, Growth Drivers, Industry Trend Analysis, and Forecast 2026 - 2035
The Global Supply Chain Visibility Software Market was valued at USD 3.3 billion in 2025 and is estimated to grow at a CAGR of 13.4% to reach USD 10.9 billion by 2035.
The shift from traditional manual tracking methods to cloud-native digital platforms is driving widespread adoption. Disruptions such as pandemics, geopolitical conflicts, and extreme weather events have highlighted vulnerabilities in conventional supply chains, prompting organizations to embrace more advanced solutions. Artificial intelligence, machine learning, and IoT sensors are enabling predictive supply chain intelligence, allowing companies to forecast demand, detect anomalies, and optimize routes efficiently. Blockchain and edge computing enhance traceability and regulatory compliance. Increasingly stringent regulations, including the EU's Corporate Sustainability Due Diligence Directive, the FDA's FSMA 204, the EU Deforestation Regulation, and the Uyghur Forced Labor Prevention Act, are accelerating adoption as organizations aim to integrate supplier data, carbon accounting, and event-based tracking to avoid penalties and improve transparency.
| Market Scope | |
|---|---|
| Start Year | 2025 |
| Forecast Year | 2026-2035 |
| Start Value | $3.3 Billion |
| Forecast Value | $10.9 Billion |
| CAGR | 13.4% |
The software segment held a 70% share in 2025 and is expected to grow at a CAGR of 12.8% through 2035. Software components, including analytics dashboards, control tower applications, and visibility platforms, are essential for capturing, processing, and displaying supply chain data.
Cloud-native SaaS models support rapid deployment, cost efficiency, and continuous updates. The cloud-based segment held a 57% share in 2025 and is forecasted to grow at a CAGR of 14.1% from 2026 to 2035. Cloud solutions offer real-time accessibility, improved collaboration, scalability, reduced upfront costs, and lower IT management burdens.
U.S. Supply Chain Visibility Software Market held a significant share in 2024, driven by e-commerce expansion, complex logistics networks, and innovation from leading companies. U.S. shippers, carriers, and third-party logistics providers are adopting visibility platforms to increase transparency and operational efficiency. AI-powered analytics and predictive insights are pivotal in enabling this transformation. Regulatory mandates such as the FSMA 204 and the Uyghur Forced Labor Prevention Act are further fueling adoption to ensure traceability and compliance.
Key players in the Supply Chain Visibility Software Market include Blue Yonder, Manhattan Associates, Project44, Oracle, SAP, IBM, Kinaxis, Infor, Descartes Systems, and FourKites. Companies in the Supply Chain Visibility Software Market are strengthening their presence through several strategies. They are investing heavily in AI, IoT, and blockchain integration to offer predictive analytics, real-time monitoring, and enhanced traceability. Strategic partnerships with logistics providers and third-party platforms expand reach and customer adoption. Cloud-based SaaS models are emphasized to reduce deployment time, provide scalability, and lower operational costs. Firms also focus on continuous software upgrades, customer training, and robust support services to enhance client satisfaction. Additionally, companies leverage analytics for insights into demand, supply risks, and regulatory compliance, ensuring they remain competitive and capable of supporting complex global supply chains.
Table of Contents
Chapter 1 Methodology
- 1.1 Market scope and definition
- 1.2 Research design
- 1.2.1 Research approach
- 1.2.2 Data collection methods
- 1.3 Data mining sources
- 1.3.1 Global
- 1.3.2 Regional/Country
- 1.4 Base estimates and calculations
- 1.4.1 Base year calculation
- 1.4.2 Key trends for market estimation
- 1.5 Primary research and validation
- 1.5.1 Primary sources
- 1.6 Forecast model
- 1.7 Research assumptions and limitations
Chapter 2 Executive Summary
- 2.1 Industry 3600 synopsis, 2022 - 2035
- 2.2 Key market trends
- 2.2.1 Regional
- 2.2.2 Component
- 2.2.3 Deployment Mode
- 2.2.4 Enterprise Size
- 2.2.5 Application
- 2.2.6 End Use
- 2.3 TAM Analysis, 2026-2035
- 2.4 CXO perspectives: Strategic imperatives
- 2.4.1 Executive decision points
- 2.4.2 Critical success factors
- 2.5 Future outlook and strategic recommendations
Chapter 3 Industry Insights
- 3.1 Industry ecosystem analysis
- 3.1.1 Supplier landscape
- 3.1.2 Profit margin analysis
- 3.1.3 Cost structure
- 3.1.4 Value addition at each stage
- 3.1.5 Factor affecting the value chain
- 3.1.6 Disruptions
- 3.2 Industry impact forces
- 3.2.1 Growth drivers
- 3.2.1.1 Digital transformation of supply chains
- 3.2.1.2 Rise of e-commerce and complex global trade
- 3.2.1.3 Need for risk management and supply-chain resilience
- 3.2.1.4 Regulatory, compliance, sustainability, and traceability requirements
- 3.2.1.5 Industry expansion and growth of key sectors
- 3.2.2 Industry pitfalls and challenges
- 3.2.2.1 High implementation and integration costs
- 3.2.2.2 Data security and privacy concerns
- 3.2.3 Market opportunities
- 3.2.3.1 Expansion in emerging markets
- 3.2.3.2 Integration with IoT and AI technologies
- 3.2.3.3 Cloud-based and SaaS solutions
- 3.2.3.4 Focus on sustainability and traceability
- 3.2.1 Growth drivers
- 3.3 Growth potential analysis
- 3.4 Regulatory landscape
- 3.4.1 FDA FSMA food traceability requirements
- 3.4.2 EU sustainability regulations (CSRD, CSDD, ESPR)
- 3.4.3 Digital product passport (DPP) mandates
- 3.4.4 EU deforestation regulation (EUDR)
- 3.4.5 Software supply chain security (SBOM, NIST SSDF)
- 3.4.6 Customs & trade compliance requirements
- 3.4.7 Data privacy & sovereignty regulations (GDPR, CCPA)
- 3.4.8 Industry-specific regulations (DSCSA, ITAR, HIPAA)
- 3.5 Porter's analysis
- 3.6 PESTEL analysis
- 3.7 Technology and innovation landscape
- 3.7.1 Current technological trends
- 3.7.1.1 Control tower architecture evolution
- 3.7.1.2 AI & machine learning for predictive analytics
- 3.7.1.3 IoT & sensor integration (GPS, RFID, telematics)
- 3.7.1.4 Blockchain for immutable traceability
- 3.7.2 Emerging technologies
- 3.7.2.1 Digital twins & simulation
- 3.7.2.2 Edge computing for real-time processing
- 3.7.2.3 Generative AI & copilots for supply chain planners
- 3.7.2.4 5G connectivity & low-latency applications
- 3.7.1 Current technological trends
- 3.8 Pricing models & total cost of ownership
- 3.8.1 SaaS subscription pricing
- 3.8.2 On-premise licensing & maintenance
- 3.8.3 Hybrid deployment economics
- 3.8.4 Implementation & integration costs
- 3.8.5 TCO comparison: cloud vs on-premise vs hybrid
- 3.8.6 Hidden costs & cost optimization strategies
- 3.8.7 Pricing trends & market dynamics
- 3.9 Patent analysis
- 3.9.1 USPTO CPC classification landscape (G06Q, G06K)
- 3.9.2 Key patent trends (2020-2025)
- 3.9.3 Predictive visibility & route optimization patents
- 3.9.4 Blockchain & traceability IP landscape
- 3.9.5 Top patent assignees & innovation leaders
- 3.9.6 Patent filing trends by geography
- 3.9.7 Freedom-to-operate considerations
- 3.10 Use cases & success stories
- 3.10.1 Manufacturing: automotive tier-N visibility
- 3.10.2 Retail: omni-channel inventory visibility
- 3.10.3 Food & beverage: FDA FSMA compliance implementation
- 3.10.4 Pharmaceuticals: serialization & track-and-trace
- 3.10.5 Logistics: real-time transportation visibility
- 3.10.6 Fashion: sustainability & ethical sourcing traceability
- 3.10.7 High-tech: component shortage mitigation
- 3.11 Sustainability and environmental aspects
- 3.11.1 Sustainable practices
- 3.11.2 Waste reduction strategies
- 3.11.3 Energy efficiency in production
- 3.11.4 Eco-friendly Initiatives
- 3.11.5 Carbon footprint considerations
- 3.12 ROI & business case analysis
- 3.12.1 Quantifiable benefits & KPIs
- 3.12.2 Logistics cost reduction (15-30%)
- 3.12.3 Inventory optimization (20-30% carrying cost reduction)
- 3.12.4 On-time delivery improvement (10-25%)
- 3.12.5 Exception management efficiency (40-60% manual reduction)
- 3.12.6 Customer satisfaction & retention impact
- 3.12.7 Implementation timeframes & time-to-value
- 3.12.8 ROI calculation methodologies
- 3.12.9 Payback period analysis by deployment model
- 3.13 Supply chain & integration landscape
- 3.13.1 ERP integration (SAP, Oracle, Microsoft Dynamics)
- 3.13.2 WMS & TMS connectivity
- 3.13.3 Carrier & 3PL network integration
- 3.13.4 IoT device & sensor onboarding
- 3.13.5 API & EDI standards
- 3.13.6 Data exchange protocols & formats
- 3.13.7 Integration complexity & best practices
- 3.14 Adoption barriers & enablers by region
- 3.14.1 North America
- 3.14.2 Europe
- 3.14.3 Asia Pacific
- 3.14.4 Latin America
- 3.14.5 Middle East & Africa
- 3.15 Vendor landscape & categorization
- 3.15.1 Pure-play visibility specialists
- 3.15.2 ERP-embedded solutions
- 3.15.3 TMS/WMS vendors with visibility
- 3.15.4 Multi-enterprise network platforms
- 3.15.5 Vertical-specific solutions
- 3.15.6 Emerging technology specialists
- 3.15.7 3PL/freight forwarder platforms
- 3.15.8 Procurement platforms with visibility
- 3.16 Industry-specific adoption patterns
- 3.16.1 Manufacturing: multi-tier supplier visibility focus
- 3.16.2 Retail & e-commerce: last-mile & fulfillment visibility
- 3.16.3 Logistics & 3PL: transportation & asset tracking
- 3.16.4 Food & beverage: regulatory traceability (FDA FSMA)
- 3.16.5 Healthcare & pharma: serialization & cold chain
- 3.16.6 Automotive: JIT & tier-N supplier visibility
- 3.16.7 Fashion & apparel: sustainability traceability
- 3.17 Change management & organizational readiness
- 3.17.1 Stakeholder alignment & executive sponsorship
- 3.17.2 Cross-functional team formation
- 3.17.3 Process redesign & standardization
- 3.17.4 Training & capability building
- 3.17.5 Supplier onboarding & collaboration
- 3.17.6 Performance metrics & KPI definition
- 3.17.7 Continuous improvement & optimization
Chapter 4 Competitive Landscape, 2025
- 4.1 Introduction
- 4.2 Company market share analysis
- 4.2.1 North America
- 4.2.2 Europe
- 4.2.3 Asia Pacific
- 4.2.4 LATAM
- 4.2.5 MEA
- 4.3 Competitive analysis of major market players
- 4.4 Competitive positioning matrix
- 4.5 Strategic outlook matrix
- 4.6 Key developments
- 4.6.1 Mergers & acquisitions
- 4.6.2 Partnerships & collaborations
- 4.6.3 New Product Launches
- 4.6.4 Expansion Plans and funding
- 4.6.4.1 Venture capital & private equity activity
- 4.6.4.2 M&A trends & consolidation
- 4.6.4.3 Strategic partnerships & alliances
- 4.6.4.4 Funding by company stage (seed, Series A-D, growth)
- 4.6.4.5 Geographic distribution of investments
- 4.6.4.6 Investor landscape & key players
Chapter 5 Market Estimates & Forecast, By Component, 2022-2035 ($Bn)
- 5.1 Key trends
- 5.2 Software
- 5.3 Services
- 5.3.1 Consulting
- 5.3.2 Implementation
- 5.3.3 Support & Maintenance
Chapter 6 Market Estimates & Forecast, By Deployment Mode, 2022-2035 ($Bn)
- 6.1 Key trends
- 6.2 Cloud
- 6.3 On-Premises
Chapter 7 Market Estimates & Forecast, By Enterprise Size, 2022-2035 ($Bn)
- 7.1 Key trends
- 7.2 Large enterprises
- 7.3 SME
Chapter 8 Market Estimates & Forecast, By Application, 2022-2035 ($Bn)
- 8.1 Key trends
- 8.2 Order management
- 8.3 Asset tracking
- 8.4 Inventory management
- 8.5 Shipment tracking
- 8.6 Supply chain planning
- 8.7 Others
Chapter 9 Market Estimates & Forecast, By End Use, 2022-2035 ($Bn)
- 9.1 Key trends
- 9.2 Retail and consumer goods
- 9.3 Healthcare and pharmaceuticals
- 9.4 Manufacturing
- 9.5 Transportation and logistics
- 9.6 Automotive
- 9.7 Aerospace and defense
- 9.8 Food and beverages
- 9.9 Others
Chapter 10 Market Estimates & Forecast, By Region, 2022 - 2035 ($Bn)
- 10.1 Key trends
- 10.2 North America
- 10.2.1 US
- 10.2.2 Canada
- 10.3 Europe
- 10.3.1 Germany
- 10.3.2 UK
- 10.3.3 France
- 10.3.4 Italy
- 10.3.5 Spain
- 10.3.6 Russia
- 10.3.7 Nordics
- 10.3.8 Portugal
- 10.3.9 Croatia
- 10.4 Asia Pacific
- 10.4.1 China
- 10.4.2 India
- 10.4.3 Japan
- 10.4.4 Australia
- 10.4.5 South Korea
- 10.4.6 Singapore
- 10.4.7 Thailand
- 10.4.8 Indonesia
- 10.4.9 Vietnam
- 10.5 Latin America
- 10.5.1 Brazil
- 10.5.2 Mexico
- 10.5.3 Argentina
- 10.6 MEA
- 10.6.1 South Africa
- 10.6.2 Saudi Arabia
- 10.6.3 UAE
- 10.6.4 Turkey
Chapter 11 Company Profiles
- 11.1 Global Players
- 11.1.1 Amazon Web Services (AWS)
- 11.1.2 Blue Yonder
- 11.1.3 Google Cloud
- 11.1.4 IBM
- 11.1.5 Infor
- 11.1.6 Manhattan Associates
- 11.1.7 Microsoft
- 11.1.8 Oracle
- 11.1.9 Salesforce
- 11.1.10 SAP
- 11.2 Regional Players
- 11.2.1 C.H. Robinson Worldwide
- 11.2.2 Coupa Software
- 11.2.3 Descartes Systems
- 11.2.4 E2open
- 11.2.5 Epicor Software
- 11.2.6 GEP
- 11.2.7 Ivalua
- 11.2.8 JAGGAER
- 11.2.9 Kinaxis
- 11.2.10 Logility
- 11.3 Emerging & Niche Players
- 11.3.1 FourKites
- 11.3.2 project44
- 11.3.3 Shippeo
- 11.3.4 TraceLink
- 11.3.5 Transporeon

