
PUBLISHER: Global Market Insights Inc. | PRODUCT CODE: 1892863

PUBLISHER: Global Market Insights Inc. | PRODUCT CODE: 1892863
Gas Valve Market Opportunity, Growth Drivers, Industry Trend Analysis, and Forecast 2026 - 2035
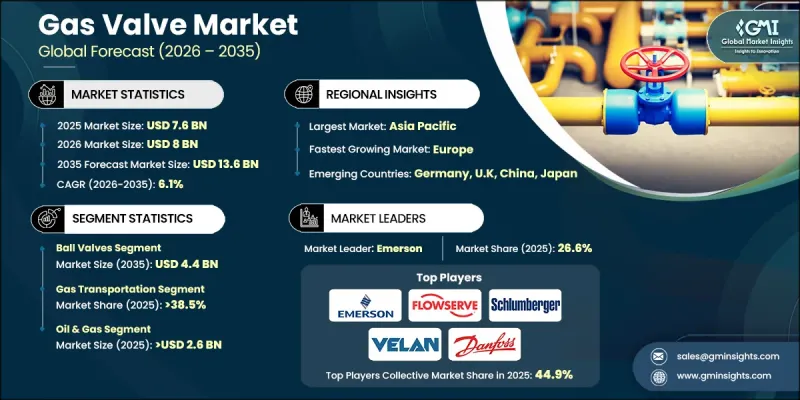
The Global Gas Valve Market was valued at USD 7.6 billion in 2025 and is estimated to grow at a CAGR of 6.1% to reach USD 13.6 billion by 2035.
Growing attention toward reducing energy consumption is accelerating the shift toward high-efficiency gas valve technologies, which has prompted manufacturers to increase production of energy-saving valve solutions. Regulatory bodies worldwide continue tightening safety and performance standards, prompting companies to upgrade designs, materials, and control systems. Requirements enforced by the U.S. Department of Energy that align with ANSI and CSA 2024 guidelines are reinforcing the need for advanced and compliant valve systems suitable for installations in utility and industrial environments. As technology adoption grows, the rise of IoT integration is transforming the industry, paving the way for smart gas valves that enable users to remotely monitor system performance, detect issues in real time, and optimize gas flow. These advancements are reshaping the competitive landscape and encouraging manufacturers to invest heavily in R&D to stay ahead of evolving safety, efficiency, and automation expectations.
| Market Scope | |
|---|---|
| Start Year | 2025 |
| Forecast Year | 2026-2035 |
| Start Value | $7.6 Billion |
| Forecast Value | $13.6 Billion |
| CAGR | 6.1% |
The ball valves segment reached USD 2.4 billion in 2025 and is projected to climb to USD 4.4 billion by 2035. Their ability to provide dependable flow control, rapid shut-off, and enhanced leak prevention makes them essential components in modern gas systems, supporting both operational performance and safety.
The gas transportation segment accounted for a 38.5% share in 2025, supported by expanding global demand for natural gas as a cleaner alternative fuel. As pipeline networks extend and infrastructure upgrades accelerate, gas valves play a crucial role in ensuring controlled flow, reliability, and system protection. Companies such as Emerson Electric remain among the leading suppliers addressing these needs in large-scale transmission environments.
U.S. Gas Valve Market captured 73% share in 2025. Growth is reinforced by the nation's extensive natural gas infrastructure and its leading position in LNG exports. Rising LNG output and ongoing pipeline expansions have significantly boosted the requirement for cryogenic and high-pressure valves used across upstream, midstream, and export facilities.
Prominent companies operating in the Global Gas Valve Market include Emerson Electric, Flowserve, Danfoss, Crane, Pentair, Velan, Watts, Neway, CNNC Sufa Technology, China Yuanda Valve, Henan Kaifeng High Pressure Valve, Schlumberger, SWI Valve, Shandong Yidu Valve, and Dalian DV Valve. To strengthen their Gas Valve Market foothold, companies in the Gas Valve Market focus on developing high-efficiency, regulation-compliant technologies that address tightening global standards. Many manufacturers are expanding their smart valve offerings by incorporating sensors, automation features, and remote monitoring capabilities to support digital asset management. Firms are also investing in advanced materials and engineering upgrades to improve durability in high-pressure, cryogenic, and corrosive environments. Strategic partnerships with energy companies, pipeline operators, and industrial facilities help streamline product integration and increase long-term contracts.
Table of Contents
Chapter 1 Methodology & Scope
- 1.1 Market scope and definition
- 1.2 Research design
- 1.2.1 Research approach
- 1.2.2 Data collection methods
- 1.3 Data mining sources
- 1.3.1 Global
- 1.3.2 Regional/Country
- 1.4 Base estimates and calculations
- 1.4.1 Base year calculation
- 1.4.2 Key trends for market estimation
- 1.5 Primary research and validation
- 1.5.1 Primary sources
- 1.6 Forecast model
- 1.7 Research assumptions and limitations
Chapter 2 Executive Summary
- 2.1 Industry 3600 synopsis
- 2.2 Key market trends
- 2.2.1 Regional
- 2.2.2 Product Type
- 2.2.3 Size
- 2.2.4 Material
- 2.2.5 Application
- 2.2.6 End Use
- 2.2.7 Distribution channel
- 2.3 CXO perspectives: Strategic imperatives
- 2.3.1 Key decision points for industry executives
- 2.3.2 Critical success factors for market players
- 2.4 Future outlook and strategic recommendations
Chapter 3 Industry Insights
- 3.1 Industry ecosystem analysis
- 3.1.1 Supplier landscape
- 3.1.2 Profit margin
- 3.1.3 Value addition at each stage
- 3.1.4 Factor affecting the value chain
- 3.2 Industry impact forces
- 3.2.1 Growth drivers
- 3.2.1.1 Increasing demand for natural gas
- 3.2.1.2 Rapid industrialization
- 3.2.1.3 Renewable energy integration
- 3.2.2 Industry pitfalls & challenges
- 3.2.2.1 Regulatory compliance
- 3.2.2.2 Price volatility of raw materials
- 3.2.3 Opportunities
- 3.2.3.1 Growth in hydrogen & LNG infrastructure
- 3.2.3.2 Adoption of smart & IoT-enabled valves
- 3.2.1 Growth drivers
- 3.3 Growth potential analysis
- 3.4 Future market trends
- 3.5 Technology and innovation landscape
- 3.5.1 Current technological trends
- 3.5.2 Emerging technologies
- 3.6 Price trends
- 3.6.1 By Product type
- 3.6.2 By Region
- 3.7 Regulatory landscape
- 3.7.1 Standards and compliance requirements
- 3.7.2 Regional regulatory frameworks
- 3.7.3 Certification standards
- 3.8 Trade statistics (HS code 84818090)
- 3.8.1 Major importing countries
- 3.8.2 Major exporting countries
- 3.9 Gap analysis
- 3.10 Risk assessment and mitigation
- 3.11 Porter's analysis
- 3.12 PESTEL analysis
Chapter 4 Competitive Landscape, 2025
- 4.1 Introduction
- 4.2 Company market share analysis
- 4.2.1 By region
- 4.2.1.1 North America
- 4.2.1.2 Europe
- 4.2.1.3 Asia Pacific
- 4.2.1.4 Latin America
- 4.2.1.5 Middle East and Africa
- 4.2.1 By region
- 4.3 Company matrix analysis
- 4.4 Competitive analysis of major market players
- 4.5 Competitive positioning matrix
- 4.6 Key developments
- 4.6.1 Mergers & acquisitions
- 4.6.2 Partnerships & collaborations
- 4.6.3 New product launches
- 4.6.4 Expansion plans
Chapter 5 Market Estimates & Forecast, By Product Type, 2022-2035 (USD Billion) (Thousand Units)
- 5.1 Key trends
- 5.2 Gate valves
- 5.3 Control valves
- 5.4 Ball valves
- 5.5 Butterfly valve
- 5.6 Plug valves
- 5.7 Others (needle valves, globe valves, drain valves, etc.)
Chapter 6 Market Estimates & Forecast, By Size, 2022-2035 (USD Billion) (Thousand Units)
- 6.1 Key trends
- 6.2 Lesser than 1inch
- 6.3 Between 1 to 6 inch
- 6.4 Between 7 to 25 inch
- 6.5 Between 26 to 50 inch
- 6.6 Greater than 50 inch
Chapter 7 Market Estimates & Forecast, By Material, 2022-2035 (USD Billion) (Thousand Units)
- 7.1 Key trends
- 7.2 Stainless steel
- 7.3 Carbon steel
- 7.4 Brass
- 7.5 Alloy & specialty materials
Chapter 8 Market Estimates & Forecast, By Application, 2022-2035 (USD Billion) (Thousand Units)
- 8.1 Key trends
- 8.2 Supplying line
- 8.3 Filling device
- 8.4 Bulk storage tank
- 8.5 Gas transportation
- 8.6 Storage tank & piping
- 8.7 Others
Chapter 9 Market Estimates & Forecast, By End Use, 2022-2035 (USD Billion) (Thousand Units)
- 9.1 Key trends
- 9.2 Water & wastewater
- 9.3 Food & beverage
- 9.4 Chemicals
- 9.5 Pharma
- 9.6 Pulp & paper
- 9.7 Oil & gas
- 9.8 Power
- 9.9 Semiconductor
- 9.10 Others
Chapter 10 Market Estimates & Forecast, By Distribution Channel, 2022-2035 (USD Billion) (Thousand Units)
- 10.1 Key trends
- 10.2 Direct sales
- 10.3 Indirect sales
Chapter 11 Market Estimates & Forecast, By Region, 2022-2035 (USD Billion) (Thousand Units)
- 11.1 Key trends
- 11.2 North America
- 11.2.1 U.S.
- 11.2.2 Canada
- 11.3 Europe
- 11.3.1 Germany
- 11.3.2 France
- 11.3.3 UK
- 11.3.4 Italy
- 11.3.5 Spain
- 11.4 Asia Pacific
- 11.4.1 China
- 11.4.2 India
- 11.4.3 Japan
- 11.4.4 South Korea
- 11.4.5 Australia
- 11.5 Latin America
- 11.5.1 Brazil
- 11.5.2 Mexico
- 11.5.3 Argentina
- 11.6 MEA
- 11.6.1 South Africa
- 11.6.2 Saudi Arabia
- 11.6.3 UAE
Chapter 12 Company Profiles
- 12.1 China Yuanda Valve
- 12.2 CNNC Sufa Technology
- 12.3 Crane
- 12.4 Dalian DV Valve
- 12.5 Danfoss
- 12.6 Emerson Electric
- 12.7 Flowserve
- 12.8 Henan Kaifeng High Pressure Valve
- 12.9 Neway
- 12.10 Pentair
- 12.11 Schlumberger
- 12.12 Shandong Yidu Valve
- 12.13 SWI Valve
- 12.14 Velan
- 12.15 Watts

