
PUBLISHER: Global Market Insights Inc. | PRODUCT CODE: 1892880

PUBLISHER: Global Market Insights Inc. | PRODUCT CODE: 1892880
Operator Training Simulator (OTS) Market Opportunity, Growth Drivers, Industry Trend Analysis, and Forecast 2026 - 2035
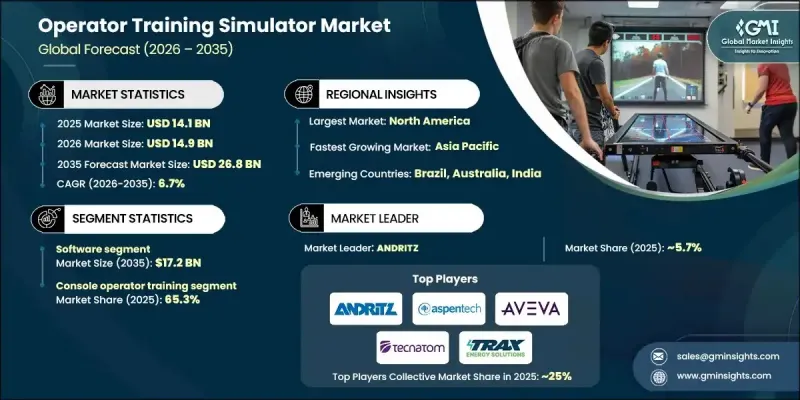
The Global Operator Training Simulator Market was valued at USD 14.1 billion in 2025 and is estimated to grow at a CAGR of 6.7% to reach USD 26.8 billion by 2035.
Immersive technologies such as Virtual Reality (VR) and Augmented Reality (AR) are transforming traditional employee training by providing interactive, three-dimensional environments that closely replicate real-world conditions. These technologies allow learners to engage with their surroundings, improving knowledge retention and reducing risk during hazardous operations. Operator training simulators are particularly critical for high-stakes industries where mistakes can have serious consequences. In addition to safety, VR and AR help overcome logistical challenges of conventional training, reducing time, cost, and exposure to dangerous conditions. As industries adopt more advanced digital solutions, the demand for immersive operator training platforms continues to rise, driving the overall growth of the market globally.
| Market Scope | |
|---|---|
| Start Year | 2025 |
| Forecast Year | 2026-2035 |
| Start Value | $14.1 Billion |
| Forecast Value | $26.8 Billion |
| CAGR | 6.7% |
The software segment held USD 8.6 billion in 2025 and is expected to reach USD 17.2 billion by 2035. Software solutions dominate the market due to their ability to replicate physical forces and operational processes through sophisticated simulation engines, high-fidelity graphics, and interactive interfaces. The demand for engaging and hands-on simulated experiences accelerates the development of innovative VR and AR software solutions.
The console operator training segment generated USD 9.2 billion in 2024, representing approximately 65.3% of the market. This segment remains dominant as most high-risk operations occur in centralized control rooms where operators monitor multiple systems, analyze data, and make rapid decisions. Simulator training ensures operators can respond correctly in emergencies, take corrective actions, and manage complex systems safely.
U.S. Operator Training Simulator Market was valued at USD 4.1 billion in 2025 and is anticipated to grow at a CAGR of 7% from 2026 to 2035. Stringent workplace safety regulations in the U.S. drive demand for advanced operator training solutions that simulate emergency responses and operational hazards. Regulatory initiatives and government programs promoting safety create strong incentives for companies to implement high-fidelity simulator platforms.
Key players in the Operator Training Simulator Market include Schneider Electric, Aspen Technology Inc., ABB Ltd., DNV AS, EON Reality, AVEVA Group Limited, TRAX Energy Solutions, Hyperion Group, Siemens, Tecnatom, Yokogawa Electric Corporation, Designing Digitally Inc., DuPont, and ESI Group. Market leaders focus on strategies such as continuous R&D to enhance software realism and simulation accuracy. Companies invest in VR and AR technology, expand platform capabilities for multiple industry applications, and integrate cloud-based solutions for remote training. Collaborations with industrial partners, customization of training modules, and after-sales support improve client retention. In addition, firms emphasize compliance with safety regulations, develop predictive analytics features, and adopt subscription-based or service-oriented pricing models to strengthen their market presence and maintain long-term competitiveness.
Table of Contents
Chapter 1 Methodology & Scope
- 1.1 Market scope and definition
- 1.2 Research design
- 1.2.1 Research approach
- 1.2.2 Data collection methods
- 1.3 Data mining sources
- 1.3.1 Global
- 1.3.2 Regional/Country
- 1.4 Base estimates and calculations
- 1.4.1 Base year calculation
- 1.4.2 Key trends for market estimation
- 1.5 Primary research and validation
- 1.5.1 Primary sources
- 1.6 Forecast model
- 1.7 Research assumptions and limitations
Chapter 2 Executive Summary
- 2.1 Industry 360° synopsis
- 2.2 Key market trends
- 2.2.1 Regional trends
- 2.2.2 Component trends
- 2.2.3 Simulation environment trends
- 2.2.4 End Use trends
- 2.2.5 Distribution channel trends
- 2.3 CXO perspective: Strategic imperatives
- 2.3.1 Key decision points for industry executives
- 2.3.2 Critical success factors for market players
- 2.4 Future outlook and strategic recommendations
- 2.5 Strategic recommendations
- 2.5.1 Supply chain diversification strategy
- 2.5.2 Product portfolio enhancement
- 2.5.3 Partnership and alliance opportunities
- 2.5.4 Cost management and pricing strategy
- 2.6 Decision framework
- 2.6.1 Investment priority matrix
- 2.6.2 ROI analysis
Chapter 3 Industry Insights
- 3.1 Industry ecosystem analysis
- 3.1.1 Supplier landscape
- 3.1.2 Profit margin
- 3.1.3 Value addition at each stage
- 3.1.4 Factor affecting the value chain
- 3.2 Industry impact forces
- 3.2.1 Growth drivers
- 3.2.2 Industry pitfalls & challenges
- 3.2.3 Opportunities
- 3.3 Growth potential analysis
- 3.4 Future market trends
- 3.5 Price trends
- 3.5.1 Region and component
- 3.5.2 Raw material cost
- 3.5.3 Real vs. perceived capacity constraints in supply of raw materials
- 3.5.4 Supplier price increase validation
- 3.6 Regulatory framework
- 3.6.1 By region
- 3.7 Porter's five forces analysis
- 3.8 PESTEL analysis
Chapter 4 Competitive Landscape, 2025
- 4.1 Introduction
- 4.2 Company market share analysis
- 4.2.1 By region
- 4.3 Company matrix analysis
- 4.4 Competitive analysis of major market players
- 4.5 Competitive positioning matrix
- 4.6 Product portfolio benchmarking
- 4.7 Key developments
- 4.7.1 Mergers & acquisitions
- 4.7.2 Partnerships & collaborations
- 4.7.3 New product launches
- 4.7.4 Expansion Plans
Chapter 5 Market Estimates & Forecast, By Component, 2022 - 2035 (USD Billion)
- 5.1 Key trends
- 5.2 Hardware
- 5.3 Software
- 5.3.1 Control simulation
- 5.3.2 Process simulation
- 5.3.3 Immersive simulation
- 5.4 Services
- 5.4.1 Consulting
- 5.4.2 Installation & environmental simulation
- 5.4.3 Maintenance & support
Chapter 6 Market Estimates & Forecast, By Simulation Environment, 2022 - 2035 (USD Billion)
- 6.1 Key trends
- 6.2 Console operator training
- 6.3 Field operator training
Chapter 7 Market Estimates & Forecast, By End Use, 2022 - 2035 (USD Billion)
- 7.1 Key trends
- 7.2 Aerospace & defense
- 7.3 Chemical
- 7.4 Energy & power
- 7.5 Healthcare
- 7.6 Industrial
- 7.7 Oil & gas
- 7.8 Pulp & paper
- 7.9 Others
Chapter 8 Market Estimates & Forecast, By Distribution Channel, 2022 - 2035, (USD Billion)
- 8.1 Key trends
- 8.2 Direct sales
- 8.3 Indirect sales
Chapter 9 Market Estimates & Forecast, By Region, 2022 - 2035, (USD Billion)
- 9.1 Key trends
- 9.2 North America
- 9.2.1 U.S.
- 9.2.2 Canada
- 9.3 Europe
- 9.3.1 Germany
- 9.3.2 U.K.
- 9.3.3 France
- 9.3.4 Italy
- 9.3.5 Spain
- 9.4 Asia Pacific
- 9.4.1 China
- 9.4.2 India
- 9.4.3 Japan
- 9.4.4 South Korea
- 9.4.5 Australia
- 9.5 Latin America
- 9.5.1 Brazil
- 9.5.2 Mexico
- 9.5.3 Argentina
- 9.6 MEA
- 9.6.1 UAE
- 9.6.2 Saudi Arabia
- 9.6.3 South Africa
Chapter 10 Company Profiles (Business Overview, Financial Data, Product Landscape, Strategic Outlook, SWOT Analysis)
- 10.1 ABB Ltd.
- 10.2 ANDRITZ
- 10.3 Aspen Technology Inc.
- 10.4 AVEVA Group Limited
- 10.5 Designing Digitally Inc.
- 10.6 DNV AS
- 10.7 DuPont
- 10.8 EON Reality
- 10.9 ESI Group
- 10.10 Hyperion Group
- 10.11 Schneider Electric
- 10.12 Siemens
- 10.13 Tecnatom
- 10.14 TRAX Energy Solutions
- 10.15 Yokogawa Electric Corporation

