
PUBLISHER: Global Market Insights Inc. | PRODUCT CODE: 1892891

PUBLISHER: Global Market Insights Inc. | PRODUCT CODE: 1892891
Thermal Transfer Ribbon Market Opportunity, Growth Drivers, Industry Trend Analysis, and Forecast 2026 - 2035
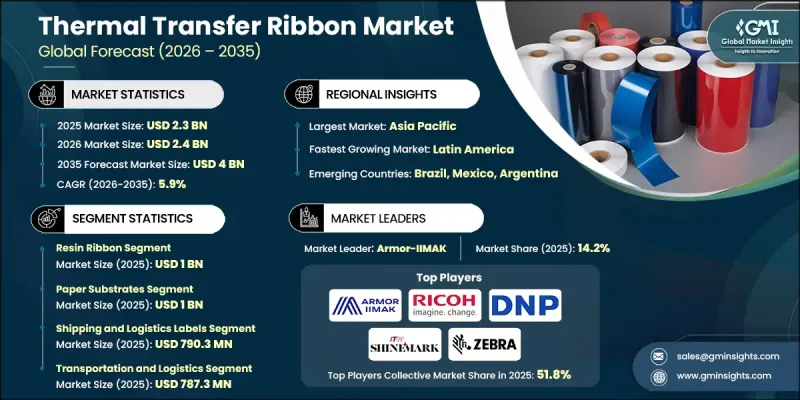
The Global Thermal Transfer Ribbon Market was valued at USD 2.3 billion in 2025 and is estimated to grow at a CAGR of 5.9% to reach USD 4 billion by 2035.
Growth is strongly supported by the rapid expansion of e-commerce and parcel logistics, which has increased demand for durable shipping labels in sorting, shipping, and last-mile delivery operations. Rising parcel volumes in national postal services and trade sectors are directly driving the consumption of wax-resin and resin ribbons. Thermal transfer ribbons are increasingly adopted in manufacturing and warehouse environments where automated label applicators and intelligent assembly lines are becoming standard. The growing use of high-precision barcodes and compliance labels helps industries improve throughput, reduce errors, and enhance real-time inventory visibility. The move toward smart packaging and traceability systems, particularly in sectors with strict safety, serialization, and audit requirements, has further boosted demand for high-performance, durable thermal prints, especially in pharmaceutical, chemical, and food processing industries.
| Market Scope | |
|---|---|
| Start Year | 2025 |
| Forecast Year | 2026-2035 |
| Start Value | $2.3 Billion |
| Forecast Value | $4 Billion |
| CAGR | 5.9% |
In 2025, the resin ribbons segment reached USD 1 billion, favored for their durability and high resistance to abrasion, chemicals, and harsh environments. They are widely used in industries demanding regulatory compliance and longevity, such as automotive, electronics, pharmaceuticals, and industrial equipment.
The paper substrates segment generated USD 1 billion in 2025, valued for their balance of cost, print quality, and versatility. High-volume printing of shipping labels, shelf tags, and product identification in retail, e-commerce fulfillment centers, and logistics operations continues to drive the demand for paper-based TTRs. The rise of omnichannel retailing and warehouse automation has further reinforced the dominance of paper substrates in scalable labeling systems.
North America Thermal Transfer Ribbon Market accounted for 27.9% share in 2025, with the U.S. leading due to its extensive logistics networks, advanced retail infrastructure, and strict labeling compliance requirements for food, pharmaceuticals, and chemicals. The growth of automated warehouses and e-commerce fulfillment centers, along with the availability of over two billion square feet of industrial and logistics space, continues to drive high-volume demand for thermal transfer ribbons and barcode printers.
Leading companies in the Global Thermal Transfer Ribbon Market include Armor-IIMAK, Dai Nippon Printing, Honeywell International, Hangzhou Todaytec Digital Technology Co., Inkstar, Dynic USA, TSC Auto ID, Ricoh Electronics, Inc., ITW ShineMark, Zebra Technologies, Avery Dennison, Brady Corporation, and SATO Holdings. Companies in the Global Thermal Transfer Ribbon Market are strengthening their positions by investing in R&D to improve ribbon formulations, durability, and print performance. Many are expanding their global distribution networks and partnering with logistics, retail, and industrial clients to ensure steady demand. Strategic product launches targeting specialized labeling applications, such as high-contrast prints for harsh environments and compliance-driven industries, help maintain competitive advantage. Firms are also leveraging automation-friendly solutions and smart packaging integrations to enhance operational efficiency for customers.
Table of Contents
Chapter 1 Methodology & Scope
- 1.1 Market scope and definition
- 1.2 Research design
- 1.2.1 Research approach
- 1.2.2 Data collection methods
- 1.3 Data mining sources
- 1.3.1 Global
- 1.3.2 Regional/Country
- 1.4 Base estimates and calculations
- 1.4.1 Base year calculation
- 1.4.2 Key trends for market estimation
- 1.5 Primary research and validation
- 1.5.1 Primary sources
- 1.6 Forecast model
- 1.7 Research assumptions and limitations
Chapter 2 Executive Summary
- 2.1 Industry 3600 synopsis
- 2.2 Key market trends
- 2.2.1 Regional
- 2.2.2 Product
- 2.2.3 Substrate compatibility
- 2.2.4 Application
- 2.2.5 End use
- 2.3 TAM Analysis, 2025-2034
- 2.4 CXO perspectives: Strategic imperatives
- 2.4.1 Executive decision points
- 2.4.2 Critical success factors
- 2.5 Future Outlook and Strategic Recommendations
Chapter 3 Industry Insights
- 3.1 Industry ecosystem analysis
- 3.1.1 Supplier Landscape
- 3.1.2 Profit Margin
- 3.1.3 Value addition at each stage
- 3.1.4 Factor affecting the value chain
- 3.1.5 Disruptions
- 3.2 Industry impact forces
- 3.2.1 Growth drivers
- 3.2.1.1 E-commerce & logistics expansion
- 3.2.1.2 Industrial automation & smart packaging
- 3.2.1.3 Increasing adoption of RFID
- 3.2.2 Industry pitfalls and challenges
- 3.2.2.1 Increasing competition from alternative printing technologies
- 3.2.2.2 Compatibility issues with diverse substrates
- 3.2.3 Market opportunities
- 3.2.3.1 Development of clinical nutrition applications
- 3.2.3.2 Integration with food waste valorization
- 3.2.1 Growth drivers
- 3.3 Growth potential analysis
- 3.4 Regulatory landscape
- 3.4.1 North America
- 3.4.2 Europe
- 3.4.3 Asia Pacific
- 3.4.4 Latin America
- 3.4.5 Middle East & Africa
- 3.5 Porter's analysis
- 3.6 PESTEL analysis
- 3.7 Price trends
- 3.7.1 By region
- 3.7.2 Product
- 3.8 Future market trends
- 3.9 Technology and Innovation Landscape
- 3.9.1 Current technological trends
- 3.9.2 Emerging technologies
- 3.10 Patent Landscape
- 3.11 Trade statistics (HS code) (Note: the trade statistics will be provided for key countries only)
- 3.11.1 Major importing countries
- 3.11.2 Major exporting countries
- 3.12 Sustainability and environmental aspects
- 3.12.1 Sustainable practices
- 3.12.2 Waste reduction strategies
- 3.12.3 Energy efficiency in production
- 3.12.4 Eco-friendly initiatives
- 3.13 Carbon footprint considerations
Chapter 4 Competitive Landscape, 2024
- 4.1 Introduction
- 4.2 Company market share analysis
- 4.2.1 By region
- 4.2.1.1 North America
- 4.2.1.2 Europe
- 4.2.1.3 Asia Pacific
- 4.2.1.4 LATAM
- 4.2.1.5 MEA
- 4.2.1 By region
- 4.3 Company matrix analysis
- 4.4 Competitive analysis of major market players
- 4.5 Competitive positioning matrix
- 4.6 Key developments
- 4.6.1 Mergers & acquisitions
- 4.6.2 Partnerships & collaborations
- 4.6.3 New product launches
- 4.6.4 Expansion plans
Chapter 5 Market Estimates and Forecast, By Product, 2022 - 2035 (USD Million) (Million Square Meters)
- 5.1 Key trends
- 5.2 Wax ribbon
- 5.3 Wax-resin ribbon
- 5.4 Resin ribbon
Chapter 6 Market Estimates and Forecast, By Substrate Compatibility, 2022 - 2035 (USD Million) (Million Square Meters)
- 6.1 Key trends
- 6.2 Paper Substrates
- 6.2.1 Uncoated paper
- 6.2.2 Coated paper (semi-gloss, matte)
- 6.3 Synthetic Substrates
- 6.3.1 Polypropylene (PP)
- 6.3.2 Polyester (PET)
- 6.3.3 Polyethylene (PE)
- 6.3.4 Vinyl
- 6.4 Textile Materials
- 6.5 Flexible packaging films
Chapter 7 Market Estimates and Forecast, By Application, 2022 - 2035 (USD Million) (Million Square Meters)
- 7.1 Key trends
- 7.2 Barcode & product labeling
- 7.2.1 Standard barcode labels
- 7.2.2 2d barcode / qr code labels
- 7.2.3 Product identification labels
- 7.3 Shipping & logistics labels
- 7.3.1 Shipping labels
- 7.3.2 Pallet labels
- 7.3.3 Cold chain labels
- 7.4 Asset tracking & identification
- 7.4.1 Asset tags
- 7.4.2 Equipment labels
- 7.4.3 IT asset labels
- 7.5 Flexible packaging
- 7.5.1 Food packaging
- 7.5.2 Beverage packaging
- 7.5.3 Pharmaceutical packaging
- 7.6 Healthcare & laboratory labels
- 7.6.1 Laboratory specimen labels
- 7.6.2 Patient wristbands
- 7.6.3 Blood bag labels
- 7.6.4 Cryogenic labels
Chapter 8 Market Estimates and Forecast, By End Use, 2022 - 2035 (USD million) (Million Square Meters)
- 8.1 Key trends
- 8.2 Retail & e-commerce
- 8.2.1 Brick-and-mortar retail
- 8.2.2 E-commerce fulfillment
- 8.2.3 Grocery & supermarkets
- 8.3 Transportation & logistics
- 8.3.1 Freight & shipping
- 8.3.2 Warehousing & distribution
- 8.3.3 Cold chain logistics
- 8.4 Healthcare & pharmaceuticals
- 8.4.1 Hospitals & clinics
- 8.4.2 Pharmaceutical manufacturing
- 8.4.3 Laboratory & diagnostics
- 8.5 Food & beverage
- 8.5.1 Food processing
- 8.5.2 Beverage production
- 8.5.3 Food retail & service
- 8.6 Automotive
- 8.6.1 OEM parts labeling
- 8.6.2 Aftermarket parts
- 8.6.3 Vehicle identification
- 8.7 Entertainment & hospitality
- 8.7.1 Event ticketing
- 8.7.2 Hotel operations
- 8.7.3 Cruise & travel
Chapter 9 Market Estimates and Forecast, By Region, 2022 - 2035 (USD million) (Million Square Meters)
- 9.1 Key trends
- 9.2 North America
- 9.2.1 U.S.
- 9.2.2 Canada
- 9.3 Europe
- 9.3.1 Germany
- 9.3.2 UK
- 9.3.3 France
- 9.3.4 Spain
- 9.3.5 Italy
- 9.3.6 Rest of Europe
- 9.4 Asia Pacific
- 9.4.1 China
- 9.4.2 India
- 9.4.3 Japan
- 9.4.4 Australia
- 9.4.5 South Korea
- 9.4.6 Rest of Asia Pacific
- 9.5 Latin America
- 9.5.1 Brazil
- 9.5.2 Mexico
- 9.5.3 Rest of Latin America
- 9.6 Middle East and Africa
- 9.6.1 Saudi Arabia
- 9.6.2 South Africa
- 9.6.3 UAE
- 9.6.4 Rest of Middle East and Africa
Chapter 10 Company Profiles
- 10.1 Dai Nippon Printing
- 10.2 Armor-IIMAK
- 10.3 Ricoh Electronics, Inc
- 10.4 ITW ShineMark
- 10.5 Honeywell International
- 10.6 Zebra Technologies
- 10.7 TSC Auto ID
- 10.8 Hangzhou Todaytec Digital Technology Co.
- 10.9 Inkstar
- 10.10 Dynic USA
- 10.11 Avery Dennison
- 10.12 SATO Holdings
- 10.13 Brady Corporation

