
PUBLISHER: Global Market Insights Inc. | PRODUCT CODE: 1892902

PUBLISHER: Global Market Insights Inc. | PRODUCT CODE: 1892902
Dock Scheduling Software Market Opportunity, Growth Drivers, Industry Trend Analysis, and Forecast 2026 - 2035
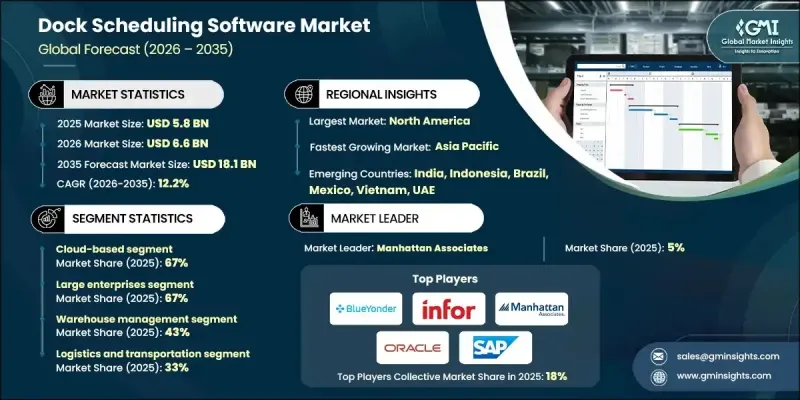
The Global Dock Scheduling Software Market was valued at USD 5.8 billion in 2025 and is estimated to grow at a CAGR of 12.2% to reach USD 18.1 billion by 2035.
The rising demand for operational efficiency is driving adoption, as minimizing the time trucks spend at docks is essential for reducing costs and turnaround times. Dock scheduling software enables companies to optimize door usage and arrange appointments, decreasing idle time and improving service levels for carriers handling high-volume shipments across retail, grocery, and e-commerce sectors. Labor shortages and rising hiring costs are compelling warehouses to allocate personnel more strategically. Scheduling software predicts staffing requirements based on expected shipment volumes and assigns employees to the busiest docks. Additionally, regulatory compliance and industry safety standards are supported, with the software tracking driver hours, reporting violations, and ensuring adherence to hours-of-service regulations while maintaining driver safety and operational efficiency.
| Market Scope | |
|---|---|
| Start Year | 2025 |
| Forecast Year | 2026-2035 |
| Start Value | $5.8 Billion |
| Forecast Value | $18.1 Billion |
| CAGR | 12.2% |
The cloud-based segment held a 67% share in 2025 and is expected to grow at a CAGR of 12.5% through 2035. Cloud deployment allows real-time carrier integration, mobile access, and lower upfront costs via the SaaS subscription model, while reducing IT management burdens.
The large enterprises segment held a 67% market share in 2025, driven by extensive warehouse networks, multiple dock doors, and complex multi-carrier operations. These enterprises leverage AI-supported optimization, multi-site visibility, and deep integration with WMS and TMS systems to maintain consistent processes across regional and national distribution centers.
U.S. Dock Scheduling Software Market generated USD 4.76 billion in 2025. Growth is fueled by tight trucking capacity, faster freight movement, and stricter regulatory scrutiny on detention times. Automation, IoT devices, and self-service portals enhance operational accuracy and improve the timeliness of product reception at distribution centers.
Key players in the Global Dock Scheduling Software Market include Descartes Systems, Manhattan Associates, Oracle, SAP, Epicor Software, Infor, Blue Yonder, Zebra Technologies, 4SIGHT Connect, and C3 Solutions. Companies in the dock scheduling software market are focusing on several strategies to strengthen their market presence. Providers are investing in AI and machine learning capabilities to enhance predictive scheduling and real-time dock optimization. Cloud deployment is being expanded to offer scalable, mobile-accessible solutions that reduce IT complexity for clients. Strategic partnerships with WMS, TMS, and ERP providers enhance platform integration, providing seamless operational workflows. Companies are also targeting large enterprises and multi-site distribution networks, offering advanced analytics, multi-carrier management, and AI-powered insights.
Table of Contents
Chapter 1 Methodology
- 1.1 Market scope and definition
- 1.2 Research design
- 1.2.1 Research approach
- 1.2.2 Data collection methods
- 1.3 Data mining sources
- 1.3.1 Global
- 1.3.2 Regional/Country
- 1.4 Base estimates and calculations
- 1.4.1 Base year calculation
- 1.4.2 Key trends for market estimation
- 1.5 Primary research and validation
- 1.5.1 Primary sources
- 1.6 Forecast model
- 1.7 Research assumptions and limitations
Chapter 2 Executive Summary
- 2.1 Industry 360° synopsis
- 2.2 Key market trends
- 2.2.1 Regional
- 2.2.2 Deployment mode
- 2.2.3 Enterprise size
- 2.2.4 Solution
- 2.2.5 Application
- 2.2.6 Component
- 2.2.7 End Use
- 2.3 TAM analysis, 2026-2035
- 2.4 CXO perspectives: Strategic imperatives
- 2.4.1 Executive decision points
- 2.4.2 Critical success factors
- 2.5 Future outlook
- 2.6 Strategic recommendations
Chapter 3 Industry Insights
- 3.1 Industry ecosystem analysis
- 3.1.1 Supplier landscape
- 3.1.2 Profit margin
- 3.1.3 Cost structure
- 3.1.4 Value addition at each stage
- 3.1.5 Factor affecting the value chain
- 3.1.6 Disruptions
- 3.2 Industry impact forces
- 3.2.1 Growth drivers
- 3.2.1.1 Need to reduce dwell time
- 3.2.1.2 Labor optimization
- 3.2.1.3 Regulatory & compliance pressures
- 3.2.1.4 Complexity of modern supply chains
- 3.2.2 Industry pitfalls and challenges
- 3.2.2.1 Integration complexity
- 3.2.2.2 Carrier & staff adoption resistance
- 3.2.3 Market opportunities
- 3.2.3.1 Expansion into SMB segment
- 3.2.3.2 E-commerce & omnichannel logistics
- 3.2.3.3 Emerging markets (APAC, LATAM, MEA)
- 3.2.3.4 Automation & robotics integration
- 3.2.1 Growth drivers
- 3.3 Growth potential analysis
- 3.4 Regulatory landscape
- 3.4.1 Global
- 3.4.1.1 Safety & performance standards
- 3.4.1.2 Environmental & sustainability regulations
- 3.4.1.3 Data privacy & cross-border data transfer
- 3.4.1.4 Transport & freight regulations
- 3.4.1.5 Industry-specific compliance
- 3.4.2 North America
- 3.4.3 Europe
- 3.4.4 Asia Pacific
- 3.4.5 Latin America
- 3.4.6 Middle East & Africa
- 3.4.1 Global
- 3.5 Porter's analysis
- 3.6 PESTEL analysis
- 3.7 Technology and innovation landscape
- 3.7.1 Current technological trends
- 3.7.1.1 Scheduling engines & optimization algorithms
- 3.7.1.2 Telematics & ETA feeds
- 3.7.1.3 Real-time yard/trailer location
- 3.7.1.4 Mobile driver apps & carrier portals
- 3.7.2 Emerging technologies
- 3.7.2.1 AI-driven predictive scheduling and anomaly detection
- 3.7.2.2 Digital twins and simulation for yard/dock flow planning
- 3.7.2.3 Blockchain for appointment provenance and audit trails
- 3.7.2.4 Autonomous yard vehicles and robotic dock handling
- 3.7.1 Current technological trends
- 3.8 Pricing analysis
- 3.8.1.1 Pricing by deployment mode
- 3.8.1.2 Pricing by unit metrics
- 3.8.1.3 Pricing by functionality tier
- 3.8.1.4 Professional services & integration costs
- 3.9 Cost breakdown analysis
- 3.9.1 Vendor cost structure
- 3.9.2 Implementation of cost components
- 3.9.3 Ongoing operational costs
- 3.9.4 Indirect customer costs
- 3.10 Patent analysis
- 3.10.1 Patent ownership by major vendors
- 3.10.2 Freedom-to-operate and IP litigation trends
- 3.11 Sustainability and environmental aspects
- 3.11.1 Sustainable practices
- 3.11.2 Waste reduction strategies
- 3.11.3 Energy efficiency in production
- 3.11.4 Eco-friendly initiatives
- 3.11.5 Carbon footprint considerations
- 3.12 Risk assessment & mitigation framework
- 3.12.1 Supply chain risks
- 3.12.2 Financial & economic risks
- 3.12.3 Regulatory & compliance risks
- 3.12.4 Operational risks
- 3.12.5 Technology & innovation risks
- 3.13 End use behavior & consumption analysis
- 3.13.1 End use segmentation framework
- 3.13.2. 3 PL & logistics provider behavior and multi-tenant needs
- 3.13.3 Retail & e-commerce adoption patterns
- 3.13.4 Manufacturing & JIT user behavior
Chapter 4 Competitive Landscape, 2025
- 4.1 Introduction
- 4.2 Company market share analysis
- 4.2.1 North America
- 4.2.2 Europe
- 4.2.3 Asia Pacific
- 4.2.4 LATAM
- 4.2.5 MEA
- 4.3 Competitive analysis of major market players
- 4.4 Competitive positioning matrix
- 4.5 Strategic outlook matrix
- 4.6 Key developments
- 4.6.1 Mergers & acquisitions
- 4.6.2 Partnerships & collaborations
- 4.6.3 New product launches
- 4.6.4 Expansion plans and funding
Chapter 5 Market Estimates & Forecast, By Deployment mode, 2022 - 2035 ($Mn)
- 5.1 Key trends
- 5.2 Cloud-based
- 5.3 On-premises
- 5.4 Hybrid
Chapter 6 Market Estimates & Forecast, By Enterprise Size, 2022 - 2035 ($Mn)
- 6.1 Key trends
- 6.2 Large enterprises
- 6.3 SMEs
Chapter 7 Market Estimates & Forecast, By Application, 2022 - 2035 ($Mn)
- 7.1 Key trends
- 7.2 Warehouse management
- 7.3 Transportation management
- 7.4 Yard management
- 7.5 Cross-docking operations
- 7.6 Others
Chapter 8 Market Estimates & Forecast, By Solution, 2022 - 2035 ($Mn)
- 8.1 Key trends
- 8.2 Standalone dock scheduling software
- 8.3 Integrated supply chain management solution
- 8.4 Yard management system with dock scheduling
Chapter 9 Market Estimates & Forecast, By Component, 2022 - 2035 ($Mn)
- 9.1 Key trends
- 9.2 Software
- 9.3 Services
Chapter 10 Market Estimates & Forecast, By End Use, 2022 - 2035 ($Mn)
- 10.1 Key trends
- 10.2 Logistics and transportation
- 10.3 Retail and e-commerce
- 10.4 Manufacturing
- 10.5 Food and beverage
- 10.6 Healthcare and pharmaceuticals
- 10.7 Wholesale and distribution
- 10.8 Others
Chapter 11 Market Estimates & Forecast, By Region, 2022 - 2035 ($Mn)
- 11.1 Key trends
- 11.2 North America
- 11.2.1 US
- 11.2.2 Canada
- 11.3 Europe
- 11.3.1 Germany
- 11.3.2 UK
- 11.3.3 France
- 11.3.4 Italy
- 11.3.5 Spain
- 11.3.6 Nordics
- 11.3.7 Russia
- 11.3.8 Poland
- 11.3.9 Romania
- 11.4 Asia Pacific
- 11.4.1 China
- 11.4.2 India
- 11.4.3 Japan
- 11.4.4 South Korea
- 11.4.5 ANZ
- 11.4.6 Vietnam
- 11.4.7 Indonesia
- 11.5 Latin America
- 11.5.1 Brazil
- 11.5.2 Mexico
- 11.5.3 Argentina
- 11.6 MEA
- 11.6.1 South Africa
- 11.6.2 Saudi Arabia
- 11.6.3 UAE
Chapter 12 Company Profiles
- 12.1 Global companies
- 12.1.1 Blue Yonder
- 12.1.2 C3 Solutions
- 12.1.3 Descartes Systems
- 12.1.4 FourKites
- 12.1.5 Infor
- 12.1.6 Korber Supply Chain
- 12.1.7 Manhattan Associates
- 12.1.8 Oracle
- 12.1.9 project44
- 12.1.10 SAP
- 12.1.11 Zebra Technologies
- 12.2 Regional players
- 12.2.1. SIGHT Connect
- 12.2.2 Alpega
- 12.2.3 Dock411
- 12.2.4. E2 open
- 12.2.5 GoRamp
- 12.2.6 Kale Logistics Solutions
- 12.2.7 Opendock
- 12.2.8 Softeon
- 12.2.9 Transporeon
- 12.2.10 Trimble Transportation
- 12.2.11 Velostics
- 12.2.12 YardView
- 12.3 Emerging players
- 12.3.1 Arrivy
- 12.3.2 Conduit
- 12.3.3 DataDocks
- 12.3.4 Epicor Software
- 12.3.5. Extensiv (formerly 3 PL Central)
- 12.3.6 LoadingCalendar

