
PUBLISHER: Global Market Insights Inc. | PRODUCT CODE: 1892909

PUBLISHER: Global Market Insights Inc. | PRODUCT CODE: 1892909
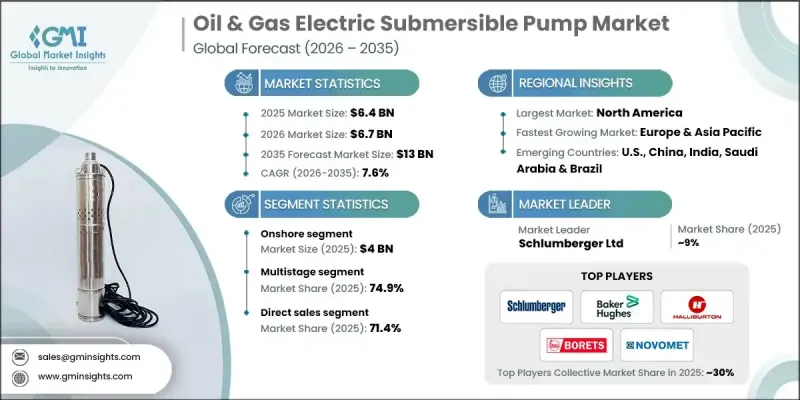
Oil and Gas Electric Submersible Pump Market Opportunity, Growth Drivers, Industry Trend Analysis, and Forecast 2026 - 2035
The Global Oil & Gas Electric Submersible Pump Market was valued at USD 6.4 billion in 2025 and is estimated to grow at a CAGR of 7.6% to reach USD 13 billion by 2035.
The rising population and rapid industrialization in emerging economies are driving an unprecedented demand for energy, especially in well-established markets. This surge in energy requirements is pushing the oil and gas sector to adopt more advanced and efficient extraction technologies, with electric submersible pumps playing a key role. ESPs are widely deployed to enhance production in aging fields and optimize extraction efficiency for large-scale operations. Despite the benefits, challenges such as high upfront costs make ESP adoption difficult for smaller operators, particularly during periods of low oil prices. However, innovations in pump design, more durable materials, and the integration of real-time monitoring systems are making ESPs increasingly efficient, reliable, and cost-effective, supporting global production growth as energy demand continues to rise.
| Market Scope | |
|---|---|
| Start Year | 2025 |
| Forecast Year | 2026-2035 |
| Start Value | $6.4 Billion |
| Forecast Value | $13 Billion |
| CAGR | 7.6% |
The onshore segment accounted for USD 4 billion in 2025 and is expected to grow at a CAGR of 7.7% from 2026 to 2035. Growth is driven by the need to maintain output from mature onshore oilfields, where artificial lift solutions are critical for sustaining production. Onshore operations also tend to be more cost-effective than offshore projects, making them attractive to operators seeking to optimize productivity while controlling operational expenses. Rising hydrocarbon demand and enhanced recovery techniques for aging reservoirs are further boosting ESP adoption for efficient fluid handling and higher production rates.
The multistage segment held a 74.9% share in 2025 and is anticipated to grow at a CAGR of 7.3% from 2026 to 2035. Multistage ESPs, with multiple impellers, provide the necessary lift to transfer significant volumes of oil, water, and gas from deep reservoirs to the surface. These pumps are ideal for high-capacity, complex wells, including unconventional and offshore fields. As exploration moves toward deeper and more challenging reservoirs, the demand for multistage systems continues to rise steadily.
US Oil & Gas Electric Submersible Pump Market is generating USD 1.41 billion in 2025 and is expected to grow at a CAGR of 8.1% through 2035. Adoption is being driven by technological improvements in ESPs, such as enhanced reliability, greater efficiency, and integration with digital monitoring systems, which allow operators to optimize performance and minimize downtime. Investments in offshore projects, coupled with the need for cost-effective methods to maximize output from declining wells, are also significant growth factors.
Key players operating in the Global Oil & Gas Electric Submersible Pump Market include Schlumberger Ltd, Halliburton, Baker Hughes, Atlas Copco AB, Flowserve Corporation, Grundfos Holding A/S, Crompton Greaves Consumer Electricals Limited, EBARA CORPORATION, Gorman-Rupp Pumps, Novomet, Sulzer Ltd, Weatherford, WILO SE, Tsurumi Manufacturing Co. Ltd., and Borets International Ltd. Companies in the Oil & Gas Electric Submersible Pump Market are focusing on innovation, R&D, and digital integration to strengthen their market position. They are developing advanced pump designs with enhanced durability, energy efficiency, and real-time monitoring capabilities to optimize production and minimize downtime. Strategic partnerships with technology providers and digital solution companies allow operators to implement predictive maintenance and automation solutions. Firms are also expanding their geographic presence in emerging oil-producing regions and providing tailored services for onshore and offshore applications.
Table of Contents
Chapter 1 Methodology & Scope
- 1.1 Market scope and definition
- 1.2 Research design
- 1.2.1 Research approach
- 1.2.2 Data collection methods
- 1.3 Data mining sources
- 1.3.1 Global
- 1.3.2 Regional/Country
- 1.4 Base estimates and calculations
- 1.4.1 Base year calculation
- 1.4.2 Key trends for market estimation
- 1.5 Primary research and validation
- 1.5.1 Primary sources
- 1.6 Forecast model
- 1.7 Research assumptions and limitations
Chapter 2 Executive Summary
- 2.1 Industry 360° synopsis
- 2.2 Key market trends
- 2.2.1 Regional
- 2.2.2 Pump type
- 2.2.3 Motor types
- 2.2.4 Power rating
- 2.2.5 Deployment method
- 2.2.6 Well depth
- 2.2.7 Control system
- 2.2.8 Deployment type
- 2.2.9 Operation
- 2.2.10 Application
- 2.3 CXO perspectives: Strategic imperatives
- 2.3.1 Key decision points for industry executives
- 2.3.2 Critical success factors for market players
- 2.4 Future outlook and strategic recommendations
Chapter 3 Industry Insights
- 3.1 Industry ecosystem analysis
- 3.1.1 Supplier landscape
- 3.1.2 Profit margin
- 3.1.3 Value addition at each stage
- 3.1.4 Factor affecting the value chain
- 3.2 Industry impact forces
- 3.2.1 Growth drivers
- 3.2.1.1 Increasing global energy demand
- 3.2.1.2 Advancements in ESP technology
- 3.2.1.3 Deepwater and ultra-deepwater exploration
- 3.2.1.4 Rising focus on carbon emission reduction
- 3.2.2 Industry pitfalls & challenges
- 3.2.2.1 High initial costs
- 3.2.2.2 Complex installation and maintenance
- 3.2.1 Growth drivers
- 3.3 Growth potential analysis
- 3.4 Future market trends
- 3.5 Technology and innovation landscape
- 3.5.1 Current technological trends
- 3.5.2 Emerging technologies
- 3.6 Price trends
- 3.6.1 By region
- 3.6.2 By pump type
- 3.7 Regulatory landscape
- 3.7.1 Standards and compliance requirements
- 3.7.2 Regional regulatory frameworks
- 3.7.3 Certification standards
- 3.8 Trade statistics
- 3.8.1 Major importing countries
- 3.8.2 Major exporting countries
- 3.9 Porter's analysis
- 3.10 PESTEL analysis
Chapter 4 Competitive Landscape, 2025
- 4.1 Introduction
- 4.2 Company market share analysis
- 4.2.1 By Region
- 4.2.1.1 North America
- 4.2.1.2 Europe
- 4.2.1.3 Asia Pacific
- 4.2.1.4 Latin America
- 4.2.1.5 Middle East & Africa
- 4.2.1 By Region
- 4.3 Company matrix analysis
- 4.4 Competitive analysis of major market players
- 4.5 Competitive positioning matrix
- 4.6 Key developments
- 4.6.1 Mergers & acquisitions
- 4.6.2 Partnerships & collaborations
- 4.6.3 New product launches
- 4.6.4 Expansion plans
Chapter 5 Market Estimates & Forecast, By Pump Type, 2022 - 2035, (USD Billion) (Thousand Units)
- 5.1 Key trends
- 5.2 Centrifugal
- 5.3 Axial flow
- 5.4 Positive displacement
- 5.5 Progressive cavity
Chapter 6 Market Estimates & Forecast, By Motor Types, 2022 - 2035, (USD Billion) (Thousand Units)
- 6.1 Key trends
- 6.2 Induction motors
- 6.3 Permanent magnet motors (PMMs)
- 6.4 High-temperature motors
Chapter 7 Market Estimates & Forecast, By Power Rating, 2022 - 2035, (USD Billion) (Thousand Units)
- 7.1 Key trends
- 7.2 Up to 500 HP
- 7.3 500-1000 HP
- 7.4 1000-2000 HP
- 7.5 Above 2000 HP
Chapter 8 Market Estimates & Forecast, By Deployment Method, 2022 - 2035, (USD Billion) (Thousand Units)
- 8.1 Key trends
- 8.2 Conventional rig-based deployment
- 8.3 Alternative & rigless deployment
Chapter 9 Market Estimates & Forecast, By Well Depth, 2022 - 2035, (USD Billion) (Thousand Units)
- 9.1 Key trends
- 9.2 Shallow wells (≤ 1,000 m)
- 9.3 Intermediate (1,000-2,500 m)
- 9.4 Deep (2,500-4,000 m)
- 9.5 Ultra-deep (> 4,000 m)
Chapter 10 Market Estimates & Forecast, By Control system, 2022 - 2035, (USD Billion) (Thousand Units)
- 10.1 Key trends
- 10.2 Fixed frequency
- 10.3 Variable speed
- 10.4 Digital optimization (Intelligent/IoT-enabled systems)
Chapter 11 Market Estimates & Forecast, By Deployment Type, 2022 - 2035, (USD Billion) (Thousand Units)
- 11.1 Key trends
- 11.2 Onshore
- 11.3 Offshore
Chapter 12 Market Estimates & Forecast, By Operation, 2022 - 2035, (USD Billion) (Thousand Units)
- 12.1 Key trends
- 12.2 Single stage
- 12.3 Multistage
Chapter 13 Market Estimates & Forecast, By Application, 2022 - 2035, (USD Billion) (Thousand Units)
- 13.1 Key trends
- 13.2 Oil production
- 13.3 Gas production
- 13.4 Water injection
- 13.5 Artificial lift (EOR)
- 13.6 Thermal recovery
Chapter 14 Market Estimates & Forecast, By Distribution Channel, 2022 - 2035, (USD Billion) (Thousand Units)
- 14.1 Key trends
- 14.2 Direct sales
- 14.3 Indirect sales
Chapter 15 Market Estimates & Forecast, By Region, 2022 - 2035, (USD Billion) (Thousand Units)
- 15.1 Key trends
- 15.2 North America
- 15.2.1 U.S.
- 15.2.2 Canada
- 15.3 Europe
- 15.3.1 Germany
- 15.3.2 UK
- 15.3.3 France
- 15.3.4 Italy
- 15.3.5 Spain
- 15.4 Asia Pacific
- 15.4.1 China
- 15.4.2 India
- 15.4.3 Japan
- 15.4.4 South Korea
- 15.4.5 Australia
- 15.4.6 Indonesia
- 15.4.7 Malaysia
- 15.5 Latin America
- 15.5.1 Brazil
- 15.5.2 Mexico
- 15.5.3 Argentina
- 15.6 MEA
- 15.6.1 Saudi Arabia
- 15.6.2 UAE
- 15.6.3 South Africa
Chapter 16 Company Profiles
- 16.1 Atlas Copco AB
- 16.2 Baker Hughes
- 16.3 Borets International Ltd
- 16.4 Crompton Greaves Consumer Electricals Limited
- 16.5 EBARA CORPORATION
- 16.6 Flowserve Corporation
- 16.7 Gorman-Rupp Pumps
- 16.8 Grundfos Holding A/S
- 16.9 Halliburton
- 16.10 Novomet
- 16.11 Schlumberger Ltd
- 16.12 Sulzer Ltd
- 16.13 Tsurumi Manufacturing Co. Ltd.
- 16.14 Weatherford
- 16.15 WILO SE

