
PUBLISHER: Global Market Insights Inc. | PRODUCT CODE: 1892913

PUBLISHER: Global Market Insights Inc. | PRODUCT CODE: 1892913
Bike Computer Market Opportunity, Growth Drivers, Industry Trend Analysis, and Forecast 2026 - 2035
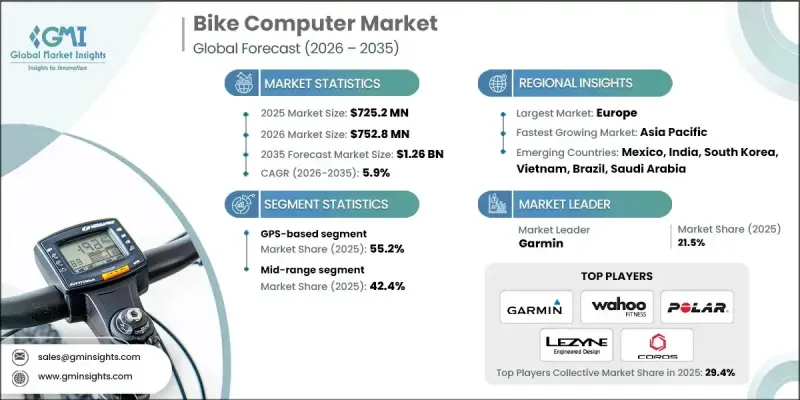
The Global Bike Computer Market was valued at USD 725.2 million in 2025 and is estimated to grow at a CAGR of 5.9% to reach USD 1.26 billion by 2035.
Growing interest in personal fitness and increasing integration of technology into everyday routines continue to elevate demand for devices that track speed, cadence, heart rate, and other performance indicators. Cycling has become a preferred activity for health-conscious individuals around the world, especially as concerns linked to lifestyle-related conditions, including diabetes, heart complications, and weight management, drive people toward more active habits. Environmental priorities also play a major role, as governments across multiple regions promote cycling to help lower carbon emissions and ease traffic congestion. Advancements in digital systems and the expanding role of AI and machine learning across mobility applications are expected to bring smarter, more intuitive bike computers to the market, strengthening their appeal. The growing adoption of cycling events and public wellness programs further supports the use of devices that enhance training and performance monitoring. As global awareness around fitness technology continues to rise, the overall demand for connected and intelligent bike computers is expected to accelerate.
| Market Scope | |
|---|---|
| Start Year | 2025 |
| Forecast Year | 2026-2035 |
| Start Value | $725.2 Million |
| Forecast Value | $1.26 Billion |
| CAGR | 5.9% |
The GPS-based segment held a 55.2% share in 2024. These devices have evolved far beyond earlier navigation tools and now provide detailed ride metrics that cyclists expect in real time. Their superior mapping capabilities make them the preferred choice compared with non-GPS alternatives, aligning with the worldwide growth of cycling for recreation, commuting, and exercise. As consumer expectations increase, riders consistently seek more accurate tracking of distance, speed, and related metrics.
The premium-priced bike computers segment will grow at a CAGR of 7.1% by 2034, owing to features such as AI-enhanced analytics, advanced health tracking, and smart battery optimization. Brands are concentrating on user preference trends to refine their offerings and introduce more integrated functions. This segment benefits from rising disposable incomes as buyers increasingly choose higher-end devices with extended capabilities.
U.S Bike Computer Market reached USD 185.2 million in 2025, supported by rapid growth in connected cycling technologies and an expanding population of bicycle users. Several companies continue to influence trends in the country by introducing next-generation features and setting benchmarks in product innovation.
Leading companies in the Bike Computer Market include Bryton, CatEye, COROS Wearables, Garmin, Hammerhead, Lezyne, Magene, Polar, Sigma, and Wahoo Fitness. Manufacturers in the bike computer industry are strengthening their market foothold by emphasizing innovation in data analytics, connectivity, and sensor technology. Many companies are deepening the integration of AI-driven insights to offer more accurate performance tracking and personalized ride analysis. Expanding product ecosystems through companion apps and wireless accessories helps brands build long-term engagement with cyclists. Firms are also focusing on lightweight designs, improved battery efficiency, and enhanced durability to appeal to both recreational and performance-oriented users. Strategic partnerships with cycling communities and professional teams help boost brand visibility, while targeted investments in premium product lines cater to consumers shifting toward high-end devices.
Table of Contents
Chapter 1 Methodology
- 1.1 Market scope and definition
- 1.2 Research design
- 1.2.1 Research approach
- 1.2.2 Data collection methods
- 1.3 Data mining sources
- 1.3.1 Global
- 1.3.2 Regional/Country
- 1.4 Base estimates and calculations
- 1.4.1 Base year calculation
- 1.4.2 Key trends for market estimation
- 1.5 Primary research and validation
- 1.5.1 Primary sources
- 1.6 Forecast
- 1.7 Research assumptions and limitations
Chapter 2 Executive Summary
- 2.1 Industry 3600 synopsis
- 2.2 Key market trends
- 2.2.1 Regional
- 2.2.2 Product
- 2.2.3 Price Range
- 2.2.4 Sensor
- 2.2.5 Connectivity
- 2.2.6 Bike
- 2.2.7 Distribution Channel
- 2.2.8 Application
- 2.2.9 End Use
- 2.3 TAM analysis, 2026-2035
- 2.4 CXO perspectives: Strategic imperatives
- 2.4.1 Executive decision points
- 2.4.2 Critical success factors
- 2.5 Future outlook and recommendations
Chapter 3 Industry Insights
- 3.1 Industry ecosystem analysis
- 3.1.1 Supplier landscape
- 3.1.2 Profit margin
- 3.1.3 Cost structure
- 3.1.4 Value addition at each stage
- 3.1.5 Factor affecting the value chain
- 3.1.6 Disruptions
- 3.2 Industry impact forces
- 3.2.1 Growth drivers
- 3.2.1.1 Global cycling participation growth & health consciousness trends
- 3.2.1.2 E-bike market expansion & integrated display demand
- 3.2.1.3 Professional cycling influence & UCI worldtour technology adoption
- 3.2.1.4 Smart city infrastructure development & cycling integration
- 3.2.2 Industry pitfalls and challenges
- 3.2.2.1 Smartphone substitution threat & free app alternatives
- 3.2.2.2 Theft risk & device security concerns in urban markets
- 3.2.3 Market opportunities
- 3.2.3.1 Emerging market penetration
- 3.2.3.2 E-bike integration & OEM partnership expansion
- 3.2.3.3 Gravel & adventure cycling segment expansion
- 3.2.3.4 Smart city & municipal cycling data platform integration
- 3.2.1 Growth drivers
- 3.3 Growth potential analysis
- 3.4 Regulatory landscape
- 3.4.1 North America
- 3.4.2 Europe
- 3.4.3 Asia Pacific
- 3.4.4 Latin America
- 3.4.5 Middle East & Africa
- 3.5 Porter's analysis
- 3.6 PESTEL analysis
- 3.7 Technology and innovation landscape
- 3.7.1 Current technological trends
- 3.7.2 Emerging technologies
- 3.7.3 Technology roadmaps & evolution
- 3.7.4 Technology adoption lifecycle analysis
- 3.8 Price trends
- 3.8.1 By region
- 3.8.2 By product
- 3.9 Patent analysis
- 3.10 Smart city & infrastructure integration
- 3.10.1 Bicycle detection technologies for traffic management
- 3.10.2 Bike computer integration with traffic infrastructure
- 3.10.3 Municipal cycling data platforms
- 3.10.4 Smart city partnership opportunities for manufacturers
- 3.11 Sensor ecosystem & accessory market
- 3.11.1 Sensor market overview & revenue contribution
- 3.11.2 Speed & cadence sensors
- 3.11.3 Heart rate monitors
- 3.11.4 Power meters
- 3.11.5 Emerging sensor categories
- 3.12 Consumer behavior & purchase decision analysis
- 3.12.1 Purchase decision factors & feature prioritization
- 3.12.2 Brand loyalty & switching behavior patterns
- 3.12.3 Influence of professional cycling & athlete endorsements
- 3.12.4 Online vs in-store purchase preferences
- 3.13 Consumer trends & preference evolution
- 3.13.1 Shift toward touchscreen vs button interfaces
- 3.13.2 Navigation feature importance growth
- 3.13.3 Smartphone integration expectations
- 3.13.4 Battery life as critical purchase factor
- 3.14 Retail channel dynamics & distribution strategies
- 3.14.1 Specialty cycling retail market share & trends
- 3.14.2 Online direct-to-consumer (DTC) growth
- 3.14.3 Mass market retail penetration
- 3.14.4 OEM bundling with bicycle purchases
- 3.15 Product lifecycle & usage pattern analysis
- 3.15.1 Average product lifespan & durability
- 3.15.2 Firmware update frequency & long-term support
- 3.15.3 Usage intensity by user segment
- 3.15.4 Seasonal usage variations & weather impact
- 3.16 Future outlook & opportunities
Chapter 4 Competitive Landscape, 2025
- 4.1 Introduction
- 4.2 Company market share analysis
- 4.2.1 North America
- 4.2.2 Europe
- 4.2.3 Asia Pacific
- 4.2.4 LATAM
- 4.2.5 MEA
- 4.3 Competitive analysis of major market players
- 4.4 Competitive positioning matrix
- 4.5 Strategic outlook matrix
- 4.6 Key developments
- 4.6.1 Mergers & acquisitions
- 4.6.2 Partnerships & collaborations
- 4.6.3 New product launches
- 4.6.4 Expansion plans and funding
- 4.7 Vendor selection criteria
Chapter 5 Market Estimates & Forecast, By Product, 2022 - 2035 ($Mn, Units)
- 5.1 Key trends
- 5.2 Wired
- 5.3 Wireless
- 5.4 GPS-based
- 5.4.1 Solar-powered
- 5.4.2 Others
Chapter 6 Market Estimates & Forecast, By Price Range, 2022 - 2035 ($Mn, Units)
- 6.1 Key trends
- 6.2 Basic
- 6.3 Mid-range
- 6.4 Premium
Chapter 7 Market Estimates & Forecast, By Sensor, 2022 - 2035 ($Mn, Units)
- 7.1 Key trends
- 7.2 Rear Wheel Sensor
- 7.3 Speed/Cadence Sensor
- 7.4 Gradient Sensor
- 7.5 Heart Rate Sensor
Chapter 8 Market Estimates & Forecast, By Connectivity, 2022 - 2035 ($Mn, Units)
- 8.1 Key trends
- 8.2 Bluetooth
- 8.3 Wi-Fi
- 8.4 ANT+
- 8.5 Others
Chapter 9 Market Estimates & Forecast, By Bike, 2022 - 2035 ($Mn, Units)
- 9.1 Key trends
- 9.2 Mountain bike
- 9.3 Road bike
- 9.4 Urban bike
- 9.5 E-bike
- 9.6 Gravel bike
Chapter 10 Market Estimates & Forecast, By Distribution Channel, 2022 - 2035 ($Mn, Units)
- 10.1 Key trends
- 10.2 Online
- 10.3 Offline
Chapter 11 Market Estimates & Forecast, By Application, 2022 - 2035 ($Mn, Units)
- 11.1 Key trends
- 11.2 Athletics & sports
- 11.3 Fitness & commuting
- 11.4 Recreational/leisure
Chapter 12 Market Estimates & Forecast, By End Use, 2022 - 2035 ($Mn, Units)
- 12.1 Key trends
- 12.2 Individual consumers
- 12.3 Bike rental/fleet operators
- 12.4 Professional teams/clubs
Chapter 13 Market Estimates & Forecast, By Region, 2022 - 2035 ($Mn, Units)
- 13.1 Key trends
- 13.2 North America
- 13.2.1 US
- 13.2.2 Canada
- 13.3 Europe
- 13.3.1 Germany
- 13.3.2 UK
- 13.3.3 France
- 13.3.4 Italy
- 13.3.5 Spain
- 13.3.6 Russia
- 13.3.7 Nordics
- 13.3.8 Benelux
- 13.4 Asia Pacific
- 13.4.1 China
- 13.4.2 India
- 13.4.3 Japan
- 13.4.4 South Korea
- 13.4.5 ANZ
- 13.4.6 Singapore
- 13.4.7 Malaysia
- 13.4.8 Indonesia
- 13.4.9 Vietnam
- 13.4.10 Thailand
- 13.5 Latin America
- 13.5.1 Brazil
- 13.5.2 Mexico
- 13.5.3 Argentina
- 13.5.4 Colombia
- 13.6 MEA
- 13.6.1 South Africa
- 13.6.2 Saudi Arabia
- 13.6.3 UAE
Chapter 14 Company Profiles
- 14.1 Global companies
- 14.1.1 Garmin
- 14.1.2 Wahoo Fitness
- 14.1.3 Polar Electro Oy
- 14.1.4 Hammerhead
- 14.1.5 Stages Cycling
- 14.1.6 Lezyne
- 14.2 Regional companies
- 14.2.1 SIGMA
- 14.2.2 Bryton
- 14.2.3 CatEye
- 14.2.4 Giant Manufacturing
- 14.2.5 Specialized Bicycle Components
- 14.2.6 Bosch eBike Systems
- 14.2.7 Shimano
- 14.2.8 Mio Technology
- 14.3 Emerging companies
- 14.3.1 Coospo
- 14.3.2 iGPSPORT
- 14.3.3 Magene
- 14.3.4 Coros
- 14.3.5 Suunto
- 14.3.6 Omata
- 14.3.7 Beeline
- 14.3.8 Xplova
- 14.3.9 Cycplus
- 14.3.10 Trek Bicycle Corporation
- 14.3.11 Cannondale

