
PUBLISHER: Global Market Insights Inc. | PRODUCT CODE: 1913282

PUBLISHER: Global Market Insights Inc. | PRODUCT CODE: 1913282
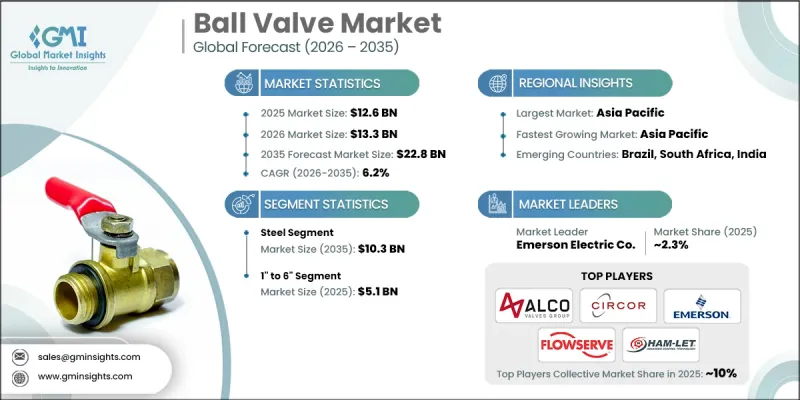
Ball Valve Market Opportunity, Growth Drivers, Industry Trend Analysis, and Forecast 2026 - 2035
The Global Ball Valve Market was valued at USD 12.6 billion in 2025 and is estimated to grow at a CAGR of 6.2% to reach USD 22.8 billion by 2035.
Rising concerns around energy security and the large-scale refurbishment of aging pipeline networks continue to support demand worldwide. Ball valves play a critical role in flow isolation and rapid shutoff functions, making them essential components across energy transportation infrastructure. Increasing regulatory oversight focused on environmental protection and operational safety strengthens adoption, particularly for new and replacement pipeline installations that require advanced flow control solutions. As global energy consumption continues to rise, infrastructure investments expand across high-growth regions, including the Asia Pacific and the Middle East, further accelerating market demand. Manufacturers benefit from long-term capital spending on pipelines, processing facilities, and transmission systems that require durable and reliable valve technologies. The combination of safety requirements, infrastructure modernization, and expanding energy networks creates a stable foundation for continued market growth.
| Market Scope | |
|---|---|
| Start Year | 2025 |
| Forecast Year | 2026-2035 |
| Start Value | $12.6 Billion |
| Forecast Value | $22.8 Billion |
| CAGR | 6.2% |
The steel-based ball valves segment generated USD 5.6 billion in 2025 and is projected to reach USD 10.3 billion by 2035. Strong mechanical performance, durability, and resistance to extreme pressure and temperature conditions make steel the preferred material across critical industrial applications where safety and reliability remain essential.
The ball valves sized between 1 inch and 6 inches segment accounted for USD 5.1 billion in 2025 and represent 40.9% share. This size range dominates due to its suitability for moderate flow systems, offering an optimal balance between capacity and efficiency across a wide range of industrial and commercial installations.
U.S. Ball Valve Market reached USD 2.2 billion in 2025 and is expected to grow at a CAGR of 4.5% from 2026 to 2035. Strong production activity across energy supply chains and regulatory requirements for advanced safety valves continue to drive demand for high-performance ball valves nationwide.
Leading companies operating in the Global Ball Valve Market include Flowserve Corporation, Emerson Electric Co, Swagelok Company, Parker Hannifin, KITZ Corporation, Circor International, SMC Corporation, Oliver Valves Ltd, HY-LOK Corporation, HOKE, Alco Valves Group, Maximator GmbH, HAM-LET Group, Hex Valve, and Haskel International, Inc. Companies strengthen their position in the Ball Valve Market through continuous product innovation, material optimization, and compliance-focused engineering. Many manufacturers invest in advanced sealing technologies and precision manufacturing to improve performance in demanding environments. Expanding regional production capabilities helps reduce lead times and improve supply reliability. Strategic partnerships with infrastructure developers and energy operators support long-term contract visibility. Firms also emphasize certification readiness, quality assurance, and lifecycle service offerings to enhance customer trust.
Table of Contents
Chapter 1 Methodology & Scope
- 1.1 Market scope and definition
- 1.2 Research design
- 1.2.1 Research approach
- 1.2.2 Data collection methods
- 1.3 Data mining sources
- 1.3.1 Global
- 1.3.2 Regional/Country
- 1.4 Base estimates and calculations
- 1.4.1 Base year calculation
- 1.4.2 Key trends for market estimation
- 1.5 Primary research and validation
- 1.5.1 Primary sources
- 1.6 Forecast model
- 1.7 Research assumptions and limitations
Chapter 2 Executive Summary
- 2.1 Industry 3600 synopsis
- 2.2 Key market trends
- 2.2.1 Regional trends
- 2.2.2 Material trends
- 2.2.3 Component trends
- 2.2.4 Size trends
- 2.2.5 End use trends
- 2.2.6 Distribution channel trends
- 2.3 CXO perspective: Strategic imperatives
- 2.3.1 Key decision points for industry executives
- 2.3.2 Critical success factors for market players
- 2.4 Future outlook and strategic recommendations
- 2.5 Strategic recommendations
- 2.5.1 Supply chain diversification strategy
- 2.5.2 Product portfolio enhancement
- 2.5.3 Partnership and alliance opportunities
- 2.5.4 Cost management and pricing strategy
- 2.6 Decision framework
- 2.6.1 Investment priority matrix
- 2.6.2 ROI analysis
Chapter 3 Industry Insights
- 3.1 Industry ecosystem analysis
- 3.1.1 Supplier Landscape
- 3.1.2 Profit Margin
- 3.1.3 Value addition at each stage
- 3.1.4 Factor affecting the value chain
- 3.2 Industry impact forces
- 3.2.1 Growth drivers
- 3.2.2 Industry pitfalls & challenges
- 3.2.3 Opportunities
- 3.3 Growth potential analysis
- 3.4 Future market trends
- 3.5 Price trends
- 3.5.1 Raw material cost
- 3.5.2 Real vs. perceived capacity constraints in supply of raw materials
- 3.5.3 Supplier price increase validation
- 3.6 Regulatory framework
- 3.6.1 By region
- 3.7 Trade statistics
- 3.7.1 Major importing countries
- 3.7.2 Major exporting countries
- 3.8 Porter's five forces analysis
- 3.9 PESTEL analysis
Chapter 4 Competitive Landscape, 2025
- 4.1 Introduction
- 4.2 Company market share analysis
- 4.2.1 By Region
- 4.3 Company matrix analysis
- 4.4 Competitive analysis of major market players
- 4.5 Competitive positioning matrix
- 4.6 Product portfolio benchmarking
- 4.7 Key developments
- 4.7.1 Mergers & acquisitions
- 4.7.2 Partnerships & collaborations
- 4.7.3 New Product Launches
- 4.7.4 Expansion Plans
Chapter 5 Market Estimates & Forecast, By Material, 2022 - 2035 (USD Billion) (Million Units)
- 5.1 Key trends
- 5.2 Steel
- 5.3 Plastic
- 5.4 Cast Iron
- 5.5 Alloy Based
- 5.6 Others (Bronze and Brass)
Chapter 6 Market Estimates & Forecast, By Component, 2022 - 2035 (USD Billion) (Million Units)
- 6.1 Key trends
- 6.2 Actuators
- 6.3 Valve Body
- 6.4 Others (Positioners and I/P Converters)
Chapter 7 Market Estimates & Forecast, By Size, 2022 - 2035 (USD Billion) (Million Units)
- 7.1 Key trends
- 7.2 <1"
- 7.3 1" to 6"
- 7.4 7" to 25"
- 7.5 26" to 50"
- 7.6 >50"
Chapter 8 Market Estimates & Forecast, By End Use, 2022 - 2035 (USD Billion) (Million Units)
- 8.1 Key trends
- 8.2 Chemical
- 8.3 Energy & utilities
- 8.4 Construction
- 8.5 Metal & mining
- 8.6 Agriculture
- 8.7 Pharmaceutical
- 8.8 Food & beverage
- 8.9 Pulp & paper
- 8.10 Others (textile, glass, and semiconductor)
Chapter 9 Market Estimates & Forecast, By Distribution Channel, 2022 - 2035, (USD Billion) (Million Units)
- 9.1 Key trends
- 9.2 Direct
- 9.3 Indirect
Chapter 10 Market Estimates & Forecast, By Region, 2022 - 2035, (USD Billion) (Million Units)
- 10.1 Key trends
- 10.2 North America
- 10.2.1 U.S.
- 10.2.2 Canada
- 10.3 Europe
- 10.3.1 Germany
- 10.3.2 U.K.
- 10.3.3 France
- 10.3.4 Italy
- 10.3.5 Spain
- 10.4 Asia Pacific
- 10.4.1 China
- 10.4.2 India
- 10.4.3 Japan
- 10.4.4 South Korea
- 10.4.5 Australia
- 10.5 Latin America
- 10.5.1 Brazil
- 10.5.2 Mexico
- 10.5.3 Argentina
- 10.6 MEA
- 10.6.1 UAE
- 10.6.2 Saudi Arabia
- 10.6.3 South Africa
Chapter 11 Company Profiles (Business Overview, Financial Data, Product Landscape, Strategic Outlook, SWOT Analysis)
- 11.1 Alco Valves Group
- 11.2 Circor International
- 11.3 Emerson Electric Co
- 11.4 Flowserve Corporation
- 11.5 HAM-LET Group
- 11.6 Haskel International, Inc
- 11.7 Hex Valve
- 11.8 HOKE
- 11.9 HY-LOK Corporation
- 11.10 KITZ Corporation
- 11.11 Maximator GmbH
- 11.12 Oliver Valves Ltd
- 11.13 Parker Hannifin
- 11.14 SMC Corporation
- 11.15 Swagelok Company

