
PUBLISHER: Global Market Insights Inc. | PRODUCT CODE: 1913347

PUBLISHER: Global Market Insights Inc. | PRODUCT CODE: 1913347
Reverse Logistics Market Opportunity, Growth Drivers, Industry Trend Analysis, and Forecast 2026 - 2035
The Global Reverse Logistics Market was valued at USD 872.6 billion in 2025 and is estimated to grow at a CAGR of 7.3% to reach USD 1.75 trillion by 2035.
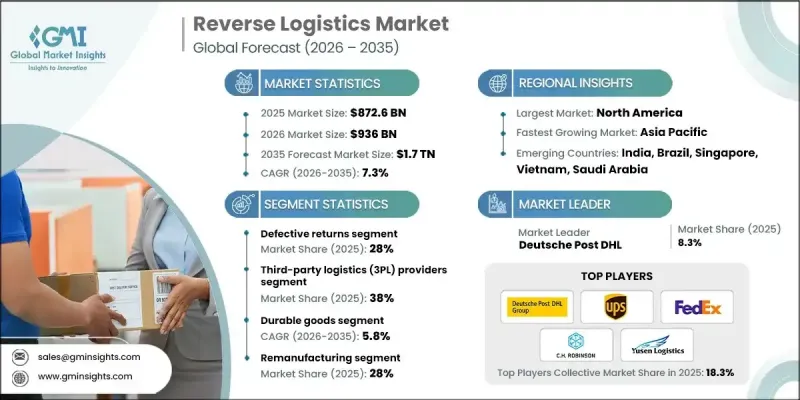
Market growth is driven by stronger corporate focus on environmental responsibility and alignment with broader sustainability objectives. Reverse logistics supports waste reduction by enabling structured recovery, reuse, and responsible disposal of returned products, helping organizations reduce environmental impact while strengthening corporate responsibility commitments. Sustainability has also become a competitive differentiator, as consumers increasingly favor companies that demonstrate responsible operational practices. The rapid expansion of digital commerce has significantly increased return volumes, intensifying the need for efficient systems to manage product movement back through the supply chain. Streamlined return handling is now closely tied to customer satisfaction, brand trust, and long-term retention. Reverse logistics also supports cost control by recovering value from returned goods, improving material efficiency, and reducing reliance on new inputs. As companies pursue circular economy models and operational resilience, reverse logistics has become a strategic function across retail, manufacturing, and distribution networks worldwide.
| Market Scope | |
|---|---|
| Start Year | 2025 |
| Forecast Year | 2026-2035 |
| Start Value | $872.6 Billion |
| Forecast Value | $1.75 Trillion |
| CAGR | 7.3% |
The defective returns segment held 28% share in 2025. High volumes of nonconforming products continue to drive reverse flows, particularly across technology-driven and consumer-focused industries. Organizations are increasingly applying advanced diagnostics and supplier collaboration tools to limit defect-related costs. Product recalls are also rising as regulatory oversight and transparency expectations continue to increase.
The durable goods segment is forecast to grow at a CAGR of 5.8% from 2026 to 2035. Strong performance is supported by higher return frequency, refurbishment potential, and sustained secondary market demand. Reverse logistics activity related to consumable products is also expanding, influenced by compliance requirements, lifecycle management, and environmental considerations.
U.S. Reverse Logistics Market reached USD 160 billion in 2025 and is expected to show strong growth through 2035. High return rates are driving investment in automation, data-driven sorting, and faster processing cycles. Many businesses are outsourcing reverse operations to improve efficiency and customer experience, while sustainability mandates and ESG initiatives continue to accelerate reuse and recovery programs.
Major companies operating in the Global Reverse Logistics Market include United Parcel Service (UPS), Deutsche Post DHL, FedEx, DB Schenker, CEVA Logistics, C.H. Robinson Worldwide, Yusen Logistics, Kintetsu World Express, NFI Industries, Optoro, and ReverseLogix. Companies in the Global Reverse Logistics Market are strengthening their competitive position through automation, digital platforms, and service integration. Investments in artificial intelligence and data analytics are improving return visibility, grading accuracy, and processing speed. Strategic partnerships with retailers and manufacturers help expand service scope and secure long-term contracts. Many providers are enhancing sustainability-focused offerings to support recycling, refurbishment, and resale initiatives. Geographic expansion and localized return centers are being used to reduce transportation costs and turnaround times. Firms are also differentiating through end-to-end solutions that integrate transportation, warehousing, and data management.
Table of Contents
Chapter 1 Methodology
- 1.1 Market scope and definition
- 1.2 Research design
- 1.2.1 Research approach
- 1.2.2 Data collection methods
- 1.3 Data mining sources
- 1.3.1 Global
- 1.3.2 Regional/Country
- 1.4 Base estimates and calculations
- 1.4.1 Base year calculation
- 1.4.2 Key trends for market estimation
- 1.5 Primary research and validation
- 1.5.1 Primary sources
- 1.6 Forecast
- 1.7 Research assumptions and limitations
Chapter 2 Executive Summary
- 2.1 Industry 360° synopsis, 2022 - 2035
- 2.2 Key market trends
- 2.2.1 Regional
- 2.2.2 Processes
- 2.2.3 Return
- 2.2.4 Service provider
- 2.2.5 Category
- 2.2.6 End use
- 2.3 TAM Analysis, 2026-2035
- 2.4 CXO perspectives: Strategic imperatives
- 2.4.1 Executive decision points
- 2.4.2 Critical success factors
- 2.5 Future outlook & strategic recommendations
Chapter 3 Industry Insights
- 3.1 Industry ecosystem analysis
- 3.1.1 Supplier landscape
- 3.1.2 Profit margin analysis
- 3.1.3 Cost structure
- 3.1.4 Value addition at each stage
- 3.1.5 Factor affecting the value chain
- 3.1.6 Disruptions
- 3.2 Industry impact forces
- 3.2.1.1 Growth drivers
- 3.2.1.2 Increasing e-commerce returns due to online shopping growth.
- 3.2.1.3 Regulatory mandates for waste management and recycling.
- 3.2.1.4 Rising focus on sustainability and circular economy adoption.
- 3.2.1.5 Cost recovery potential from returned goods and recyclable materials.
- 3.2.1.6 Technological advancements: AI, IoT, and blockchain for tracking and automation
- 3.2.2 Industry pitfalls and challenges
- 3.2.2.1 High operational costs for transportation and processing of returns.
- 3.2.2.2 Complexity in managing multi-channel returns.
- 3.2.3 Market opportunities
- 3.2.3.1 Integration with green logistics and carbon footprint reduction initiatives.
- 3.2.3.2 Expansion of refurbished and secondary markets.
- 3.2.3.3 Adoption of smart reverse logistics solutions (AI, predictive analytics).
- 3.2.3.4 Partnerships between manufacturers, retailers, and recycling firms.
- 3.3 Growth potential analysis
- 3.4 Regulatory landscape
- 3.4.1 North America
- 3.4.1.1 U.S. - Resource Conservation and Recovery Act (RCRA) & Extended Producer Responsibility (EPR) Laws
- 3.4.1.2 Canada - Canadian Environmental Protection Act (CEPA) & Provincial EPR Programs
- 3.4.2 Europe
- 3.4.2.1 UK - Waste Electrical and Electronic Equipment (WEEE) Regulations
- 3.4.2.2 Germany - Circular Economy Act (Kreislaufwirtschaftsgesetz)
- 3.4.2.3 France - Anti-Waste Law for a Circular Economy (AGEC Law)
- 3.4.2.4 Italy - Environmental Code (Legislative Decree 152/2006)
- 3.4.2.5 Spain - Waste and Contaminated Soils Law
- 3.4.3 Asia Pacific
- 3.4.3.1 China - Extended Producer Responsibility System & Solid Waste Pollution Prevention Law
- 3.4.3.2 Japan - Home Appliance Recycling Act & End-of-Life Vehicle Recycling Law
- 3.4.3.3 India - E-Waste Management Rules & Plastic Waste Management Rules
- 3.4.4 Latin America
- 3.4.4.1 Brazil - National Solid Waste Policy (PNRS)
- 3.4.4.2 Mexico - General Law for Waste Prevention and Integral Management (LGPGIR)
- 3.4.4.3 Argentina - Integrated Waste Management Law
- 3.4.5 Middle East & Africa
- 3.4.5.1 UAE - Federal Law on Waste Management
- 3.4.5.2 South Africa - National Environmental Management: Waste Act
- 3.4.5.3 Saudi Arabia - Waste Management Regulation
- 3.4.1 North America
- 3.5 Porter's analysis
- 3.6 PESTEL analysis
- 3.7 Technology and innovation landscape
- 3.7.1 Current technological trends
- 3.7.2 Emerging technologies
- 3.8 Cost breakdown analysis
- 3.8.1 Development cost structure
- 3.8.2 R&D cost analysis
- 3.8.3 Marketing & sales costs
- 3.9 Patent analysis
- 3.10 Sustainability and environmental aspects
- 3.10.1 Sustainable practices
- 3.10.2 Waste reduction strategies
- 3.10.3 Energy efficiency in production
- 3.10.4 Eco-friendly Initiatives
- 3.11 Returns behavior & return-rate dynamics
- 3.11.1 Return rate analysis by industry and product category
- 3.11.2 Impact of liberal return policies on reverse logistics volumes
- 3.11.3 Seasonal and promotional return fluctuations
- 3.12 Risk landscape in reverse logistics operations
- 3.13 Future operating models & industry evolution
- 3.13.1 Platform-based reverse logistics ecosystems
- 3.13.2 Decentralized and on-demand return processing
- 3.13.3 Long-term implications of zero-waste mandates
Chapter 4 Competitive Landscape, 2025
- 4.1 Introduction
- 4.2 Company market share analysis
- 4.2.1 North America
- 4.2.2 Europe
- 4.2.3 Asia Pacific
- 4.2.4 LATAM
- 4.2.5 MEA
- 4.3 Competitive analysis of major market players
- 4.4 Competitive positioning matrix
- 4.5 Strategic outlook matrix
- 4.6 Key developments
- 4.6.1 Mergers & acquisitions
- 4.6.2 Partnerships & collaborations
- 4.6.3 New Product Launches
- 4.6.4 Expansion Plans and funding
Chapter 5 Market Estimates & Forecast, By Processes, 2021 - 2034 ($Bn)
- 5.1 Key trends
- 5.2 Returns management
- 5.3 Remanufacturing
- 5.4 Recycling
- 5.5 Disposal
- 5.6 Others
Chapter 6 Market Estimates & Forecast, By Return, 2021 - 2034 ($Bn)
- 6.1 Key trends
- 6.2 Defective returns
- 6.3 Recalled returns
- 6.4 B2B returns and commercial returns
- 6.5 Repairable returns
- 6.6 End of life returns
- 6.7 Others
Chapter 7 Market Estimates & Forecast, By Service Provider, 2021 - 2034 ($Bn)
- 7.1 Key trends
- 7.2 In-house reverse logistics
- 7.3 Third-party logistics (3PL) Providers
- 7.4 Recycling companies
- 7.5 Waste management companies
Chapter 8 Market Estimates & Forecast, By Category, 2022 - 2035 (USD Mn)
- 8.1 Key trends
- 8.2 Durable Goods
- 8.3 Consumables
- 8.4 Industrial Equipment
- 8.5 Packaging Materials
- 8.6 Others
Chapter 9 Market Estimates & Forecast, By End Use, 2021 - 2034 ($Bn)
- 9.1 Key trends
- 9.2 Retail & E-commerce
- 9.3 Electronics
- 9.4 Automotive
- 9.5 Pharmaceuticals
- 9.6 Manufacturing
- 9.7 Others
Chapter 10 Market Estimates & Forecast, By Region, 2022 - 2035 (USD Mn)
- 10.1 Key trends
- 10.2 North America
- 10.2.1 US
- 10.2.2 Canada
- 10.3 Europe
- 10.3.1 Germany
- 10.3.2 UK
- 10.3.3 France
- 10.3.4 Italy
- 10.3.5 Spain
- 10.3.6 Russia
- 10.3.7 Nordics
- 10.3.8 Portugal
- 10.3.9 Croatia
- 10.3.10 Benelux
- 10.4 Asia Pacific
- 10.4.1 China
- 10.4.2 India
- 10.4.3 Japan
- 10.4.4 Australia
- 10.4.5 South Korea
- 10.4.6 Singapore
- 10.4.7 Thailand
- 10.4.8 Indonesia
- 10.4.9 Vietnam
- 10.5 Latin America
- 10.5.1 Brazil
- 10.5.2 Mexico
- 10.5.3 Argentina
- 10.5.4 Colombia
- 10.6 MEA
- 10.6.1 South Africa
- 10.6.2 Saudi Arabia
- 10.6.3 UAE
- 10.6.4 Turkey
Chapter 11 Company Profiles
- 11.1 Global Players
- 11.1.1 Deutsche Post DHL
- 11.1.2 United Parcel Service (UPS)
- 11.1.3 FedEx
- 11.1.4 CMA CGM
- 11.1.5 DB Schenker
- 11.1.6 CEVA Logistics
- 11.1.7 XPO Logistics
- 11.1.8 Ryder System
- 11.1.9 C.H. Robinson Worldwide
- 11.1.10 Yusen Logistics
- 11.1.11 Kintetsu World Express
- 11.1.12 Ingram Micro Commerce & Lifecycle Services
- 11.1.13 Logistics Plus
- 11.2 Regional Players
- 11.2.1 NFI Industries
- 11.2.2 Pitney Bowes
- 11.2.3 Blue Dart Express
- 11.2.4 Safexpress
- 11.2.5 Reverse Logistics
- 11.2.6 Stena Recycling
- 11.2.7 R2 Logistics
- 11.2.8 Inmar Intelligence
- 11.3 Emerging / Disruptor Players
- 11.3.1 Happy Returns (a PayPal company)
- 11.3.2 Optoro
- 11.3.3 ReverseLogix
- 11.3.4 Apto Solutions
- 11.3.5 Forterra Solutions
- 11.3.6 Core Logistic
- 11.3.7 Softbox Systems
- 11.3.8 R2 Logistics
- 11.3.9 Forterra Solutions

