
PUBLISHER: Global Market Insights Inc. | PRODUCT CODE: 1913374

PUBLISHER: Global Market Insights Inc. | PRODUCT CODE: 1913374
Silver Nanowires Market Opportunity, Growth Drivers, Industry Trend Analysis, and Forecast 2026 - 2035
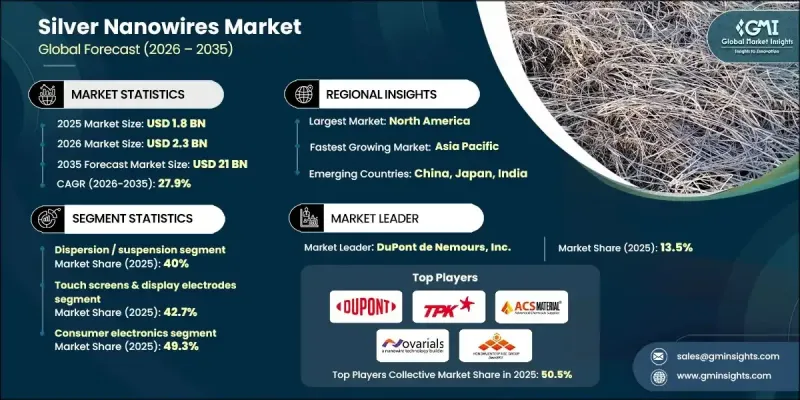
The Global Silver Nanowires Market was valued at USD 1.8 billion in 2025 and is estimated to grow at a CAGR of 27.9% to reach USD 21 billion by 2035.
Market growth is supported by the rising adoption of advanced conductive materials across next-generation electronic systems that require flexibility, lightweight structures, and high performance. Silver nanowires are increasingly preferred due to their superior electrical conductivity, high optical clarity, and mechanical adaptability, which support the development of innovative device architectures. Growing demand for compact, multifunctional, and portable electronic solutions is accelerating research into printable coatings and conductive inks, strengthening the role of silver nanowires across emerging applications. Manufacturers are also scaling production capabilities to meet rising volume requirements while maintaining material consistency and cost efficiency. In parallel, increasing investments in sustainable energy infrastructure are driving demand for transparent and flexible conductive materials that improve performance efficiency and durability. These combined trends are positioning silver nanowires as a critical component across rapidly expanding technology ecosystems, with continued innovation expected to reinforce long-term market growth.
| Market Scope | |
|---|---|
| Start Year | 2025 |
| Forecast Year | 2026-2035 |
| Start Value | $1.8 Billion |
| Forecast Value | $21 Billion |
| CAGR | 27.9% |
The inks and pastes segment generated USD 0.5 billion in 2025. This segment is gaining importance as precision deposition techniques and printed electronics manufacturing gain wider acceptance, enabling scalable and cost-effective production while maintaining high conductivity and uniformity.
The healthcare and medical device segment is projected to grow at a CAGR of 26.5% through 2035. Silver nanowires are increasingly integrated into advanced sensing and diagnostic platforms, supported by their ability to deliver stable electrical performance alongside mechanical flexibility suited to complex device designs.
North America Silver Nanowires Market reached USD 865.2 million in 2025 and is expected to maintain attractive growth through the forecast period. Regional leadership is driven by strong investment in advanced manufacturing, material science research, and technology commercialization, along with supportive policy frameworks and innovation-focused supply chains.
Key companies operating in the Global Silver Nanowires Market include DuPont de Nemours, Inc., TPK Holding Co., Ltd., NanoTechLabs, Inc., ACS Material, LLC, Nanogap Sub-nm Powder S.A., Materic LLC, Guangzhou Hongwu Material Technology Co., Ltd., Novarials Corporation, Blue Nano, Inc., and Suzhou Cold Stone Nano Material Technology Co., Ltd. Companies in the Global Silver Nanowires Market are strengthening their market position by prioritizing scalable production methods and improving material uniformity to meet rising commercial demand. Many players are investing heavily in research and development to enhance conductivity, transparency, and durability while reducing overall material costs. Strategic collaborations with downstream manufacturers are enabling faster product integration and customized solutions. Firms are also expanding their global distribution networks to improve supply reliability and market access.
Table of Contents
Chapter 1 Methodology & Scope
- 1.1 Market scope and definition
- 1.2 Research design
- 1.2.1 Research approach
- 1.2.2 Data collection methods
- 1.3 Data mining sources
- 1.3.1 Global
- 1.3.2 Regional/Country
- 1.4 Base estimates and calculations
- 1.4.1 Base year calculation
- 1.4.2 Key trends for market estimation
- 1.5 Primary research and validation
- 1.5.1 Primary sources
- 1.6 Forecast model
- 1.7 Research assumptions and limitations
Chapter 2 Executive Summary
- 2.1 Industry 3600 synopsis
- 2.2 Key market trends
- 2.2.1 Regional
- 2.2.2 Product Form
- 2.2.3 Application
- 2.2.4 End Use
- 2.3 TAM Analysis, 2025-2034
- 2.4 CXO perspectives: Strategic imperatives
- 2.4.1 Executive decision points
- 2.4.2 Critical success factors
- 2.5 Future Outlook and Strategic Recommendations
Chapter 3 Industry Insights
- 3.1 Industry ecosystem analysis
- 3.1.1 Supplier landscape
- 3.1.2 Profit margin
- 3.1.3 Value addition at each stage
- 3.1.4 Factor affecting the value chain
- 3.1.5 Disruptions
- 3.2 Industry impact forces
- 3.2.1 Growth drivers
- 3.2.1.1 Growing demand for touchscreens & displays
- 3.2.1.2 Expansion of flexible & printed electronics
- 3.2.1.3 Rising renewable energy & energy storage applications
- 3.2.2 Industry pitfalls and challenges
- 3.2.2.1 High manufacturing cost of silver nanowires
- 3.2.2.2 Competition from alternative transparent conductors
- 3.2.2.3 Durability & oxidation issues
- 3.2.3 Market opportunities
- 3.2.3.1 Growth in automotive smart electronics
- 3.2.3.2 Expansion in biomedical & healthcare devices
- 3.2.3.3 Emerging markets in Asia Pacific
- 3.2.1 Growth drivers
- 3.3 Growth potential analysis
- 3.4 Regulatory landscape
- 3.4.1 North America
- 3.4.2 Europe
- 3.4.3 Asia Pacific
- 3.4.4 Latin America
- 3.4.5 Middle East & Africa
- 3.5 Porter's analysis
- 3.6 PESTEL analysis
- 3.7 Price trends
- 3.7.1 By region
- 3.7.2 By product form
- 3.8 Future market trends
- 3.9 Technology and Innovation landscape
- 3.9.1 Current technological trends
- 3.9.2 Emerging technologies
- 3.10 Patent Landscape
- 3.11 Trade statistics (HS code) ( Note: the trade statistics will be provided for key countries only)
- 3.11.1 Major importing countries
- 3.11.2 Major exporting countries
- 3.12 Sustainability and environmental aspects
- 3.12.1 Sustainable practices
- 3.12.2 Waste reduction strategies
- 3.12.3 Energy efficiency in production
- 3.12.4 Eco-friendly initiatives
- 3.13 Carbon footprint consideration
Chapter 4 Competitive Landscape, 2025
- 4.1 Introduction
- 4.2 Company market share analysis
- 4.2.1 By region
- 4.2.1.1 North America
- 4.2.1.2 Europe
- 4.2.1.3 Asia Pacific
- 4.2.1.4 LATAM
- 4.2.1.5 MEA
- 4.2.1 By region
- 4.3 Company matrix analysis
- 4.4 Competitive analysis of major market players
- 4.5 Competitive positioning matrix
- 4.6 Key developments
- 4.6.1 Mergers & acquisitions
- 4.6.2 Partnerships & collaborations
- 4.6.3 New Product Launches
- 4.6.4 Expansion Plans
Chapter 5 Market Estimates and Forecast, By Product Form, 2022-2035 (USD Billion) (Kilo Tons)
- 5.1 Key trends
- 5.2 Dispersion/Suspension
- 5.3 Ink/Paste
- 5.4 Transparent Conductive Film (TCF)
- 5.5 Dry Powder/Aerogel
Chapter 6 Market Estimates and Forecast, By Application, 2022-2035 (USD Billion) (Kilo Tons)
- 6.1 Key trends
- 6.2 Touch Screens & Display Electrodes
- 6.3 Flexible/Printed Electronics
- 6.4 Transparent Heaters
- 6.5 Photovoltaics & Energy Storage
- 6.6 Sensing & Biosensors
- 6.7 OLED/LED Devices
- 6.8 Antimicrobial Materials
- 6.9 EMI Shielding & Thermal Management
Chapter 7 Market Estimates and Forecast, By End Use, 2022-2035 (USD Billion) (Kilo Tons)
- 7.1 Key trends
- 7.2 Consumer Electronics
- 7.3 Automotive & Transportation
- 7.4 Healthcare & Medical Devices
- 7.5 Energy & Utilities
- 7.6 Building & Construction
- 7.7 Textile & Apparel
- 7.8 Industrial & Manufacturing
Chapter 8 Market Estimates and Forecast, By Region, 2022-2035 (USD Billion) (Kilo Tons)
- 8.1 Key trends
- 8.2 North America
- 8.2.1 U.S.
- 8.2.2 Canada
- 8.3 Europe
- 8.3.1 Germany
- 8.3.2 UK
- 8.3.3 France
- 8.3.4 Spain
- 8.3.5 Italy
- 8.3.6 Rest of Europe
- 8.4 Asia Pacific
- 8.4.1 China
- 8.4.2 India
- 8.4.3 Japan
- 8.4.4 Australia
- 8.4.5 South Korea
- 8.4.6 Rest of Asia Pacific
- 8.5 Latin America
- 8.5.1 Brazil
- 8.5.2 Mexico
- 8.5.3 Argentina
- 8.5.4 Rest of Latin America
- 8.6 Middle East and Africa
- 8.6.1 Saudi Arabia
- 8.6.2 South Africa
- 8.6.3 UAE
- 8.6.4 Rest of Middle East and Africa
Chapter 9 Company Profiles
- 9.1 ACS Material, LLC
- 9.2 Blue Nano, Inc.
- 9.3 DuPont de Nemours, Inc.
- 9.4 Guangzhou Hongwu Material Technology Co., Ltd.
- 9.5 Materic LLC
- 9.6 Nanogap Sub-nm Powder S.A.
- 9.7 NanoTechLabs, Inc.
- 9.8 Novarials Corporation
- 9.9 Suzhou Cold Stone Nano Material Technology Co., Ltd.
- 9.10 TPK Holding Co., Ltd.

