
PUBLISHER: Global Market Insights Inc. | PRODUCT CODE: 1913376

PUBLISHER: Global Market Insights Inc. | PRODUCT CODE: 1913376
Cargo Vans Market Opportunity, Growth Drivers, Industry Trend Analysis, and Forecast 2026 - 2035
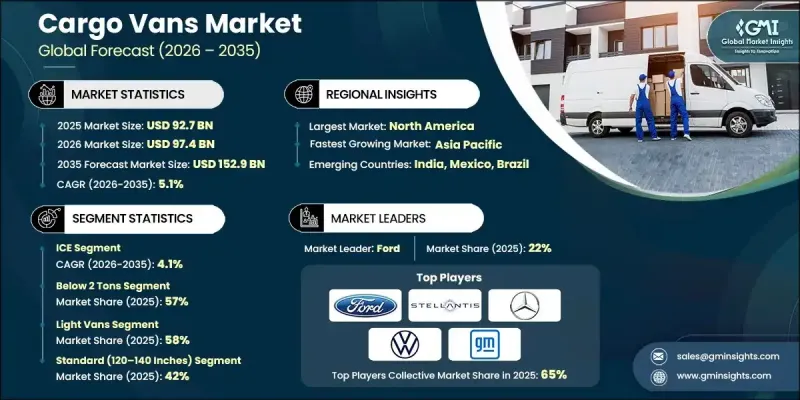
The Global Cargo Vans Market was valued at USD 92.7 billion in 2025 and is estimated to grow at a CAGR of 5.1% to reach USD 152.9 billion by 2035.
Market expansion is driven by the steady rise in urban logistics activities and increasing demand for efficient commercial transportation solutions worldwide. The rapid growth of e-commerce platforms, retail distribution networks, and service-based industries is significantly increasing the need for cargo vans to support goods movement across both urban and semi-urban areas. Rising parcel volumes and extended fleet utilization are encouraging logistics providers to invest in reliable and cost-efficient vehicles. At the same time, regulatory pressure to improve fuel efficiency and reduce emissions is influencing fleet replacement cycles, pushing operators toward newer cargo van models with enhanced performance and lower operating expenses. Continuous advancements in vehicle design, drivetrain technologies, and durability are further improving the reliability and operational lifespan of cargo vans. As cities continue to expand and last-mile delivery becomes increasingly critical, cargo vans are emerging as a vital component of modern transportation and distribution ecosystems, supporting sustained market growth across regions.
| Market Scope | |
|---|---|
| Start Year | 2025 |
| Forecast Year | 2026-2035 |
| Start Value | $92.7 Billion |
| Forecast Value | $152.9 Billion |
| CAGR | 5.1% |
The below 2 tons segment accounted for a 57.4% share in 2025 and is expected to grow at a CAGR of 4.7% from 2026 to 2035. Cargo vans within this payload category are widely preferred for last-mile deliveries and service operations due to their maneuverability, efficiency, and adequate load capacity. Their ability to operate efficiently in dense urban settings while meeting daily delivery requirements continues to support strong adoption.
The standard cargo vans with a wheelbase ranging between 120 and 140 inches held a 42% share in 2025. These vehicles are extensively used for regional distribution and multi-stop delivery routes, as they offer an optimal balance between cargo space and ease of navigation. Their configuration supports efficient route planning and maximized fleet utilization for logistics operators.
United States Cargo Vans Market held 88.5% share, generating USD 26.5 billion in 2025. Strong demand is being driven by the rapid expansion of logistics, e-commerce fulfillment, and service-oriented businesses, prompting companies to modernize and expand their commercial vehicle fleets.
Key companies operating in the Global Cargo Vans Market include Ford, Toyota, Volkswagen, Stellantis, Mercedes-Benz Vans, General Motors, Hyundai/Kia, Rivian, SAIC through its Maxus and LDV brands, and the Shyft Group. Companies in the Global Cargo Vans Market are reinforcing their competitive position by focusing on product innovation, efficiency improvements, and portfolio diversification. Manufacturers are investing in advanced powertrain technologies and lightweight vehicle designs to meet evolving regulatory requirements and reduce the total cost of ownership for fleet operators. Strategic partnerships with logistics providers and fleet customers are being leveraged to secure long-term contracts and stable demand. Many players are also expanding manufacturing capabilities and regional footprints to improve supply chain resilience and delivery timelines.
Table of Contents
Chapter 1 Methodology
- 1.1 Market scope and definition
- 1.2 Research design
- 1.2.1 Research approach
- 1.2.2 Data collection methods
- 1.3 Data mining sources
- 1.3.1 Global
- 1.3.2 Regional/Country
- 1.4 Base estimates and calculations
- 1.4.1 Base year calculation
- 1.4.2 Key trends for market estimation
- 1.5 Primary research and validation
- 1.5.1 Primary sources
- 1.6 Forecast model
- 1.7 Research assumptions and limitations
Chapter 2 Executive Summary
- 2.1 Industry 3600 synopsis, 2022 - 2035
- 2.2 Key market trends
- 2.2.1 Regional
- 2.2.2 Propulsion
- 2.2.3 Tonnage Capacity
- 2.2.4 Vehicle Class
- 2.2.5 Wheelbase & Size
- 2.2.6 Commercial End Use
- 2.2.7 Sales Channel
- 2.3 TAM Analysis, 2026-2035
- 2.4 CXO perspectives: Strategic imperatives
- 2.4.1 Executive decision points
- 2.4.2 Critical success factors
- 2.5 Future outlook and strategic recommendations
Chapter 3 Industry Insights
- 3.1 Industry ecosystem analysis
- 3.1.1 Supplier landscape
- 3.1.2 Profit margin analysis
- 3.1.3 Cost structure
- 3.1.4 Value addition at each stage
- 3.1.5 Factor affecting the value chain
- 3.1.6 Disruptions
- 3.2 Industry impact forces
- 3.2.1.1 Growth drivers
- 3.2.1.2 Growth of urban logistics and last mile delivery
- 3.2.1.3 Expansion of e commerce and organized retail
- 3.2.1.4 Fleet renewal and efficiency improvement
- 3.2.1.5 Adoption of alternative powertrains
- 3.2.2 Industry pitfalls and challenges
- 3.2.2.1 High vehicle acquisition costs
- 3.2.2.2 Urban congestion and parking limitations
- 3.2.3 Market opportunities
- 3.2.3.1 Electrification of commercial fleets
- 3.2.3.2 Growth in cold chain and specialized logistics
- 3.2.3.3 Expansion in emerging markets
- 3.3 Growth potential analysis
- 3.4 Regulatory landscape
- 3.4.1 North America
- 3.4.1.1 Federal Motor Carrier Safety Administration (FMCSA) Regulations
- 3.4.1.2 Environmental Protection Agency (EPA) Emission Standards
- 3.4.1.3 California Air Resources Board (CARB) Regulations
- 3.4.2 Europe
- 3.4.2.1 EU Commercial Vehicle Regulations
- 3.4.2.2 Euro 6 Emission Standards
- 3.4.2.3 General Safety Regulation (GSR)
- 3.4.2.4 EU Type Approval Framework
- 3.4.2.5 Digital Tachograph Rules
- 3.4.2.6 Low Emission Zones (LEZ) and Zero Emission Zones (ZEZ)
- 3.4.3 Asia Pacific
- 3.4.3.1 China National VI Emission Standards
- 3.4.3.2 India Automotive Industry Standards (AIS)
- 3.4.3.3 Japan Fuel Economy Standards
- 3.4.3.4 ASEAN Automotive Regulations
- 3.4.3.5 Heavy and Medium Duty Vehicle Regulations
- 3.4.4 Latin America
- 3.4.4.1 Brazil Proconve Emission Standards
- 3.4.4.2 Argentina CAFE and Safety Standards
- 3.4.4.3 Mexico NOM Standards
- 3.4.4.4 USMCA Vehicle Regulatory Alignment
- 3.4.5 Middle East & Africa
- 3.4.5.1 UAE Federal Transport Law
- 3.4.5.2 Saudi Transport and Logistics Regulations
- 3.4.5.3 South African Road Traffic Act
- 3.4.5.4 East African Community (EAC) Vehicle Regulations
- 3.4.1 North America
- 3.5 Porter's analysis
- 3.6 PESTEL analysis
- 3.7 Technology and innovation landscape
- 3.7.1 Current technological trends
- 3.7.2 Emerging technologies
- 3.8 Price trends
- 3.8.1 By region
- 3.8.2 By product
- 3.9 Production statistics
- 3.9.1 Production hubs
- 3.9.2 Consumption hubs
- 3.9.3 Export and import
- 3.10 Cost breakdown analysis
- 3.10.1 Vehicle acquisition costs
- 3.10.2 Transportation and delivery costs
- 3.10.3 Operational and maintenance costs
- 3.10.4 Regulatory and compliance costs
- 3.10.5 Fuel and energy costs
- 3.11 Patent analysis
- 3.12 Sustainability and environmental aspects
- 3.12.1 Sustainable practices
- 3.12.2 Waste reduction strategies
- 3.12.3 Energy efficiency in production
- 3.12.4 Eco-friendly Initiatives
- 3.12.5 Carbon footprint considerations
- 3.13 Go-to-Market strategies
- 3.13.1 Region-specific market penetration strategies
- 3.13.2 Key regulatory considerations for new entrants
- 3.13.3 Pricing, service, and differentiation strategies
Chapter 4 Competitive Landscape, 2025
- 4.1 Introduction
- 4.2 Company market share analysis
- 4.2.1 North America
- 4.2.2 Europe
- 4.2.3 Asia Pacific
- 4.2.4 LATAM
- 4.2.5 MEA
- 4.3 Competitive analysis of major market players
- 4.4 Competitive positioning matrix
- 4.5 Strategic outlook matrix
- 4.6 Key developments
- 4.6.1 Mergers & acquisitions
- 4.6.2 Partnerships & collaborations
- 4.6.3 New Product Launches
- 4.6.4 Expansion Plans and funding
Chapter 5 Market Estimates & Forecast, By Propulsion, 2022 - 2035 ($Bn, Units)
- 5.1 Key trends
- 5.2 ICE
- 5.3 Electric
- 5.3.1 Battery Electric Vehicle (BEV)
- 5.3.2 Hybrid Electric Vehicle (HEV)
- 5.3.3 Plug-in Hybrid Electric Vehicle (PHEV)
Chapter 6 Market Estimates & Forecast, By Tonnage Capacity, 2022 - 2035 ($Bn, Units)
- 6.1 Key trends
- 6.2 Below 2 tons
- 6.3 2 to 3 tons
- 6.4 Above 3 tons
Chapter 7 Market Estimates & Forecast, By Vehicle Class, 2022 - 2035 ($Bn, Units)
- 7.1 Key trends
- 7.2 Light vans (Class 1-2)
- 7.3 Medium vans (Class 3)
- 7.4 Heavy/step vans (Class 4-6)
Chapter 8 Market Estimates & Forecast, By Wheelbase & Size, 2022 - 2035 ($Bn, Units)
- 8.1 Key trends
- 8.2 Compact (wheelbase <120 inches)
- 8.3 Standard (120-140 inches)
- 8.4 Extended (140-160 inches)
- 8.5 Extra-long (>160 inches)
Chapter 9 Market Estimates & Forecast, By Commercial End Use, 2022 - 2035 ($Bn, Units)
- 9.1 Key trends
- 9.2 Last-mile delivery
- 9.3 Courier/parcel
- 9.4 Field services
- 9.5 Others
Chapter 10 Market Estimates & Forecast, By Sales Channel, 2022 - 2035 ($Bn, Units)
- 10.1 Key trends
- 10.2 OEM
- 10.3 Authorized dealership networks
Chapter 11 Market Estimates & Forecast, By Region, 2022 - 2035 ($Bn, Units)
- 11.1 Key trends
- 11.2 North America
- 11.2.1 US
- 11.2.2 Canada
- 11.3 Europe
- 11.3.1 Germany
- 11.3.2 UK
- 11.3.3 France
- 11.3.4 Italy
- 11.3.5 Spain
- 11.3.6 Russia
- 11.3.7 Nordics
- 11.3.8 Netherlands
- 11.3.9 Sweden
- 11.4 Asia Pacific
- 11.4.1 China
- 11.4.2 India
- 11.4.3 Japan
- 11.4.4 Australia
- 11.4.5 South Korea
- 11.4.6 Singapore
- 11.4.7 Thailand
- 11.4.8 Indonesia
- 11.4.9 Vietnam
- 11.5 Latin America
- 11.5.1 Brazil
- 11.5.2 Mexico
- 11.5.3 Argentina
- 11.6 MEA
- 11.6.1 South Africa
- 11.6.2 Saudi Arabia
- 11.6.3 UAE
- 11.6.4 Turkey
Chapter 12 Company Profiles
- 12.1 Global Players
- 12.1.1 Ford
- 12.1.2 General Motors
- 12.1.3 Hyundai/Kia
- 12.1.4 Mercedes-Benz Vans
- 12.1.5 Nissan
- 12.1.6 Renault Group
- 12.1.7 SAIC
- 12.1.8 Stellantis
- 12.1.9 Toyota
- 12.1.10 Volkswagen
- 12.2 Regional Players
- 12.2.1 BYD
- 12.2.2 Changan Automobile
- 12.2.3 Dongfeng Motor Corporation
- 12.2.4 GAC Group
- 12.2.5 Isuzu Motors
- 12.2.6 Iveco
- 12.3 Emerging Players / Disruptors
- 12.3.1 Arrival
- 12.3.2 Greenkraft
- 12.3.3 Rivian
- 12.3.4 Workhorse Group

