
PUBLISHER: Global Market Insights Inc. | PRODUCT CODE: 1913400

PUBLISHER: Global Market Insights Inc. | PRODUCT CODE: 1913400
Self-Checkout System Market Opportunity, Growth Drivers, Industry Trend Analysis, and Forecast 2026 - 2035
The Global Self-Checkout System Market was valued at USD 5.3 billion in 2025 and is estimated to grow at a CAGR of 13.7% to reach USD 18.8 billion by 2035.
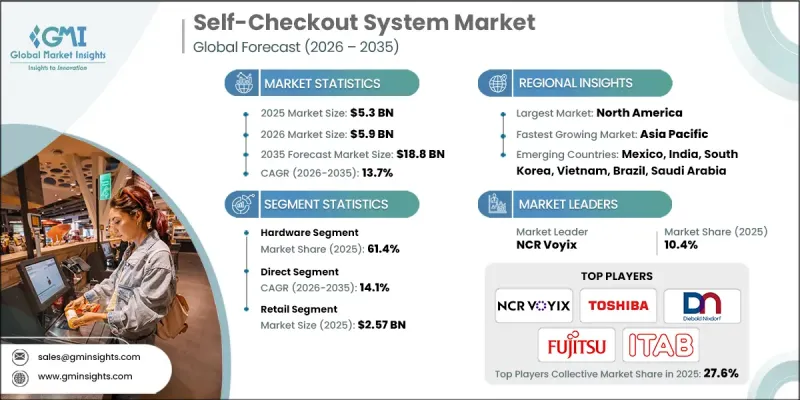
Growth is driven by rising customer volumes across public and commercial environments, which place increasing pressure on traditional checkout counters. Managing long queues and overcrowding has become a major operational challenge, prompting organizations to adopt automated checkout solutions. Self-checkout systems enable faster transaction completion, minimize dependency on on-site staff, and significantly improve customer convenience. These systems also allow businesses to reassign employees to higher-value tasks, improving workforce efficiency. The market is increasingly shifting toward automated and cashless checkout environments as digital payment adoption rises globally. Contactless payment options and seamless transaction experiences are becoming core expectations, supporting widespread system deployment. As operational efficiency and customer experience remain top priorities, self-checkout solutions continue to gain traction as a strategic investment across multiple service-oriented industries.
| Market Scope | |
|---|---|
| Start Year | 2025 |
| Forecast Year | 2026-2035 |
| Start Value | $5.3 Billion |
| Forecast Value | $18.8 Billion |
| CAGR | 13.7% |
The hardware segment accounted for 61.4% share in 2025. Strong demand for reliable and durable checkout components continues to support this dominance. Integrated hardware systems that combine scanning, display, and payment functionality simplify installation and maintenance, making them highly attractive for high-traffic environments.
The retail segment reached USD 2.57 billion and represented 48.5% share in 2025. Retailers have adopted self-checkout systems extensively to accelerate transaction speed, reduce labor dependency, and handle high customer footfall efficiently.
U.S. Self-Checkout System Market reached USD 1.75 billion in 2025. Market growth is supported by the strong presence of large-format retail operations and continuous investment in checkout automation. Technology providers increasingly prioritize the U.S. as a key revenue-generating region due to its advanced retail infrastructure and high adoption rates.
Key companies operating in the Self-Checkout System Market include Toshiba Global Commerce, Diebold Nixdorf, NCR Voyix, Fujitsu, ITAB, StrongPoint ASA, Pan-Oston, ECR Software, Wintec, and HiStone POS. Companies in the Self-Checkout System Market strengthen their competitive position through continuous hardware innovation and software integration. Manufacturers focus on developing robust, all-in-one systems that reduce installation complexity and improve uptime. Investment in cashless and contactless payment compatibility enhances system relevance. Strategic partnerships with retailers support large-scale deployments and long-term contracts. Firms also emphasize modular designs that allow easy upgrades and scalability. Improving system accuracy, security, and user interface design helps boost customer acceptance. Expanding global distribution networks and providing strong after-sales support further reinforce market presence and customer loyalty.
Table of Contents
Chapter 1 Methodology
- 1.1 Market scope and definition
- 1.2 Research design
- 1.2.1 Research approach
- 1.2.2 Data collection methods
- 1.3 Data mining sources
- 1.3.1 Global
- 1.3.2 Regional/Country
- 1.4 Base estimates and calculations
- 1.4.1 Base year calculation
- 1.4.2 Key trends for market estimation
- 1.5 Primary research and validation
- 1.5.1 Primary sources
- 1.6 Forecast
- 1.7 Research assumptions and limitations
Chapter 2 Executive Summary
- 2.1 Industry 3600 synopsis
- 2.2 Key market trends
- 2.2.1 Regional
- 2.2.2 Offering
- 2.2.3 Transaction
- 2.2.4 Model
- 2.2.5 Sales Channel
- 2.2.6 Autonomy Level
- 2.2.7 Application
- 2.3 TAM analysis, 2026-2035
- 2.4 CXO perspectives: Strategic imperatives
- 2.4.1 Executive decision points
- 2.4.2 Critical success factors
- 2.5 Future outlook and recommendations
Chapter 3 Industry Insights
- 3.1 Industry ecosystem analysis
- 3.1.1 Supplier landscape
- 3.1.2 Profit margin
- 3.1.3 Cost structure
- 3.1.4 Value addition at each stage
- 3.1.5 Factor affecting the value chain
- 3.1.6 Disruptions
- 3.2 Industry impact forces
- 3.2.1 Growth drivers
- 3.2.1.1 Rising demand for contactless and faster checkout experience
- 3.2.1.2 Growing adoption of automation in retail stores
- 3.2.1.3 Reduced operational costs for retailers
- 3.2.1.4 Expansion of supermarkets, hypermarkets, and convenience stores
- 3.2.2 Industry pitfalls and challenges
- 3.2.2.1 High initial deployment and maintenance costs
- 3.2.2.2 Limited adoption in small and budget-constrained retailers
- 3.2.3 Market opportunities
- 3.2.3.1 Growing demand from emerging markets and developing economies
- 3.2.3.2 Rising adoption in non-retail segments
- 3.2.3.3 Expansion of AI-powered autonomous checkout solutions
- 3.2.3.4 Integration with mobile apps, loyalty programs, and analytics
- 3.2.1 Growth drivers
- 3.3 Growth potential analysis
- 3.4 Regulatory landscape
- 3.4.1 North America
- 3.4.1.1 PCI Data Security Standard (PCI DSS)
- 3.4.1.2 US State-Level Legislation
- 3.4.1.3 Canadian PIPEDA
- 3.4.2 Europe
- 3.4.2.1 EU General Data Protection Regulation (GDPR)
- 3.4.2.2 EU AI Act
- 3.4.2.3 UK Digital Identity and Attributes Trust Framework
- 3.4.2.4 Payment Services Directive 2 (PSD2)
- 3.4.3 Asia Pacific
- 3.4.3.1 China's Cybersecurity Law (CSL)
- 3.4.3.2 Local Digital Payment Integration Standards
- 3.4.4 Latin America
- 3.4.4.1 Brazil PIX instant payment system security requirements
- 3.4.4.2 Mandatory Two-Factor Authentication (2FA)
- 3.4.5 Middle East & Africa
- 3.4.5.1 GCC National Payment Security Frameworks
- 3.4.5.2 South Africa's Protection of Personal Information Act (POPIA)
- 3.4.1 North America
- 3.5 Porter's analysis
- 3.6 PESTEL analysis
- 3.7 Technology and innovation landscape
- 3.7.1 Current technological trends
- 3.7.2 Emerging technologies
- 3.8 Price trends
- 3.8.1 By region
- 3.8.2 By product
- 3.9 Cost breakdown analysis
- 3.10 Sustainability and environmental impact
- 3.10.1 Environmental impact assessment
- 3.10.2 Social impact & community benefits
- 3.10.3 Governance & corporate responsibility
- 3.10.4 Sustainable finance & investment trends
- 3.11 Case studies
- 3.12 Future outlook & opportunities
Chapter 4 Competitive Landscape, 2025
- 4.1 Introduction
- 4.2 Company market share analysis
- 4.2.1 North America
- 4.2.2 Europe
- 4.2.3 Asia Pacific
- 4.2.4 LATAM
- 4.2.5 MEA
- 4.3 Competitive analysis of major market players
- 4.4 Competitive positioning matrix
- 4.5 Strategic outlook matrix
- 4.6 Key developments
- 4.6.1 Mergers & acquisitions
- 4.6.2 Partnerships & collaborations
- 4.6.3 New product launches
- 4.6.4 Expansion plans and funding
Chapter 5 Market Estimates & Forecast, By Offering, 2022 - 2035 ($Bn, Units)
- 5.1 Key trends
- 5.2 Hardware
- 5.2.1 Entertainment
- 5.2.2 Healthcare
- 5.2.3 Hospitality
- 5.2.4 Retail
- 5.2.5 Travel
- 5.2.6 Others
- 5.3 Software
- 5.4 Services
Chapter 6 Market Estimates & Forecast, By Transaction, 2022 - 2035 ($Bn, Units)
- 6.1 Key trends
- 6.2 Cash-based
- 6.3 Cashless
- 6.3.1 Contact
- 6.3.2 Contactless
- 6.3.3 Hybrid
Chapter 7 Market Estimates & Forecast, By Model, 2022 - 2035 ($Bn, Units)
- 7.1 Key trends
- 7.2 Standalone
- 7.3 Wall-mounted or countertop
- 7.4 Mobile
Chapter 8 Market Estimates & Forecast, By Sales Channel, 2022 - 2035 ($Bn, Units)
- 8.1 Key trends
- 8.2 Direct
- 8.3 Indirect
Chapter 9 Market Estimates & Forecast, By Autonomy Level, 2022 - 2035 ($Bn, Units)
- 9.1 Key trends
- 9.2 Semi-automated
- 9.3 fully-automated
Chapter 10 Market Estimates & Forecast, By Application, 2022 - 2035 ($Bn, Units)
- 10.1 Key trends
- 10.2 Entertainment
- 10.3 Healthcare
- 10.4 Hospitality
- 10.4.1 Hotel
- 10.4.2 Restaurants
- 10.4.3 Others
- 10.5 Retail
- 10.5.1 Supermarkets & Hypermarkets
- 10.5.2 Convenience Stores
- 10.5.3 Department Stores
- 10.5.4 Others
- 10.6 Travel
- 10.7 Others
Chapter 11 Market Estimates & Forecast, By Region, 2022 - 2035 ($Bn, Units)
- 11.1 Key trends
- 11.2 North America
- 11.2.1 US
- 11.2.2 Canada
- 11.3 Europe
- 11.3.1 Germany
- 11.3.2 UK
- 11.3.3 France
- 11.3.4 Italy
- 11.3.5 Spain
- 11.3.6 Russia
- 11.3.7 Nordics
- 11.3.8 Benelux
- 11.4 Asia Pacific
- 11.4.1 China
- 11.4.2 India
- 11.4.3 Japan
- 11.4.4 South Korea
- 11.4.5 ANZ
- 11.4.6 Singapore
- 11.4.7 Malaysia
- 11.4.8 Indonesia
- 11.4.9 Vietnam
- 11.4.10 Thailand
- 11.5 Latin America
- 11.5.1 Brazil
- 11.5.2 Mexico
- 11.5.3 Argentina
- 11.5.4 Colombia
- 11.6 MEA
- 11.6.1 South Africa
- 11.6.2 Saudi Arabia
- 11.6.3 UAE
Chapter 12 Company Profiles
- 12.1 Global companies
- 12.1.1 NCR Voyix
- 12.1.2 Diebold Nixdorf
- 12.1.3 Toshiba Global Commerce
- 12.1.4 Fujitsu
- 12.1.5 ITAB
- 12.1.6 IBM
- 12.1.7 Zebra Technologies
- 12.1.8 Verifone
- 12.1.9 Glory
- 12.1.10 StrongPoint ASA
- 12.1.11 Honeywell
- 12.1.12 Pan-Oston
- 12.1.13 DXC Technology
- 12.2 Regional companies
- 12.2.1 Qingdao CCL Technology
- 12.2.2 HiStone POS
- 12.2.3 Qingdao Wintec System
- 12.2.4 Pyramid Computer
- 12.2.5 Hisense Systems
- 12.2.6 ECR Software
- 12.2.7 PCMS
- 12.3 Emerging companies
- 12.3.1 Mashgin
- 12.3.2 Zippin
- 12.3.3 Trigo
- 12.3.4 Standard Cognition
- 12.3.5 ShelfX

