
PUBLISHER: Global Market Insights Inc. | PRODUCT CODE: 1928877

PUBLISHER: Global Market Insights Inc. | PRODUCT CODE: 1928877
Environmental Sensors Market Opportunity, Growth Drivers, Industry Trend Analysis, and Forecast 2026 - 2035
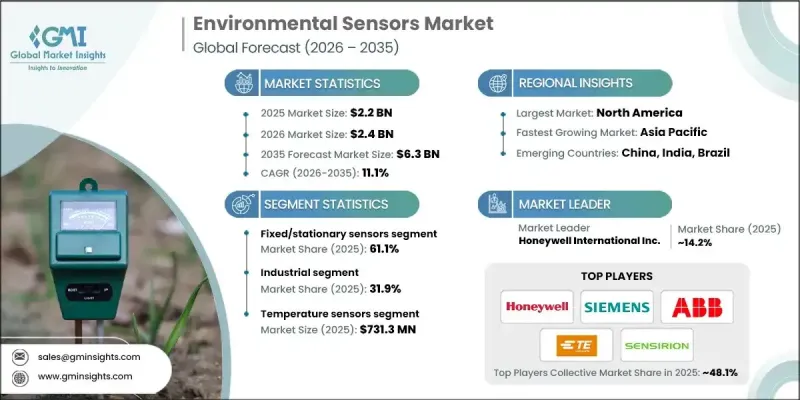
The Global Environmental Sensors Market was valued at USD 2.2 billion in 2025 and is estimated to grow at a CAGR of 11.1% to reach USD 6.3 billion by 2035.
Market expansion is fueled by increasing industrial emission regulations, the rise of wireless and connected sensing platforms, greater adoption of environmental monitoring in agriculture, and the accelerated implementation of smart city projects and IoT-enabled infrastructure. Environmental sensors are becoming essential for sustainable urban management, industrial safety, and precision agriculture, allowing real-time monitoring of air quality, water resources, soil health, and biodiversity. The demand for connected sensor networks is growing, enabling predictive analytics, optimized operations, and data-driven decision-making. By 2030, most cities and industrial facilities are expected to rely on fully integrated sensor networks for enhanced efficiency, safety, and sustainability across multiple sectors.
| Market Scope | |
|---|---|
| Start Year | 2025 |
| Forecast Year | 2026-2035 |
| Start Value | $2.2 Billion |
| Forecast Value | $6.3 Billion |
| CAGR | 11.1% |
The fixed and stationary sensors segment accounted for 61.1% share in 2025. These sensors are widely used because they provide continuous, accurate monitoring in industrial plants, urban systems, and water and wastewater facilities. They are critical for regulatory compliance, environmental management, and process control, enabling reliable operations and seamless integration with automated systems.
The industrial sector held 31.9% share in 2025. Industries rely heavily on environmental sensors to manage processes, control emissions, comply with safety standards, and mitigate operational risks. Sectors such as manufacturing, processing, and heavy industry drive demand due to strict regulatory requirements and the need for efficient, safe operations.
North America Environmental Sensors Market held a 29.8% share in 2025. Growth in the region is driven by stringent regulatory frameworks, rising concern for air quality, workplace safety, and emissions control. Adoption of IoT-enabled and wireless sensors across urban planning, transportation, and industrial applications is accelerating, supported by advanced smart city initiatives and regulatory compliance requirements.
Leading companies in the Global Environmental Sensors Market include Honeywell International Inc., Siemens AG, Bosch Sensortec GmbH, Murata Manufacturing Co., Ltd., STMicroelectronics N.V., TE Connectivity Ltd., ABB Ltd., ams OSRAM AG, Analog Devices, Inc., NXP Semiconductors, Sensirion AG, Omron Corporation, Renesas Electronics Corporation, Emerson Electric Co., Hach Company, Zebra Technologies, Vaisala, and Texas Instruments Incorporated. Companies in the Global Environmental Sensors Market are strengthening their market position by focusing on product innovation, developing sensors with enhanced accuracy, wireless capabilities, and IoT integration. Many are investing in strategic partnerships with smart city planners and industrial operators to expand adoption. Geographic expansion into emerging regions with rising urbanization and industrialization is a key strategy. Firms are also emphasizing sustainable and energy-efficient sensor technologies to meet regulatory requirements and corporate ESG goals.
Table of Contents
Chapter 1 Methodology and Scope
- 1.1 Market scope and definition
- 1.2 Research design
- 1.2.1 Research approach
- 1.2.2 Data collection methods
- 1.3 Data mining sources
- 1.3.1 Global
- 1.3.2 Regional/Country
- 1.4 Base estimates and calculations
- 1.4.1 Base year calculation
- 1.4.2 Key trends for market estimation
- 1.5 Primary research and validation
- 1.5.1 Primary sources
- 1.6 Forecast model
- 1.7 Research assumptions and limitations
Chapter 2 Executive Summary
- 2.1 Industry 360° synopsis, 2022 - 2035
- 2.2 Key market trends
- 2.2.1 Sensor type trends
- 2.2.2 Type trends
- 2.2.3 Connectivity trends
- 2.2.4 Application trends
- 2.2.5 End Use industry trends
- 2.2.6 Regional trends
- 2.3 TAM Analysis, 2026-2035
- 2.4 CXO perspectives: Strategic imperatives
- 2.4.1 Executive decision points
- 2.4.2 critical success factors
- 2.5 Future outlook and strategic recommendations
Chapter 3 Industry Insights
- 3.1 Industry ecosystem analysis
- 3.1.1 Supplier Landscape
- 3.1.2 Profit Margin
- 3.1.3 Cost structure
- 3.1.4 Value addition at each stage
- 3.1.5 Factor affecting the value chain
- 3.1.6 Disruptions
- 3.2 Industry impact forces
- 3.2.1 Growth drivers
- 3.2.1.1 Expansion of industrial emissions and safety regulations
- 3.2.1.2 Growth of connected/wireless industrial sensing platforms
- 3.2.1.3 Increasing adoption of environmental sensing in agriculture
- 3.2.1.4 Rising demand for air and water quality compliance monitoring
- 3.2.1.5 Smart city and IoT infrastructure deployment growth
- 3.2.2 Industry pitfalls and challenges
- 3.2.2.1 High cost of precision and multi-parameter sensing solutions
- 3.2.2.2 Limited interoperability and calibration complexities
- 3.2.3 Market opportunities
- 3.2.3.1 Integration of AI-driven predictive analytics in environmental sensing
- 3.2.3.2 Expansion of portable and wearable sensing devices
- 3.2.1 Growth drivers
- 3.3 Growth potential analysis
- 3.4 Regulatory landscape
- 3.4.1 North America
- 3.4.2 Europe
- 3.4.3 Asia Pacific
- 3.4.4 Latin America
- 3.4.5 Middle East & Africa
- 3.5 Porter';s analysis
- 3.6 PESTEL analysis
- 3.7 Technology and Innovation landscape
- 3.7.1 Current technological trends
- 3.7.2 Emerging technologies
- 3.8 Price trends
- 3.8.1 By region
- 3.8.2 By product
- 3.9 Pricing Strategies
- 3.10 Emerging Business Models
- 3.11 Compliance Requirements
- 3.12 Patent and IP analysis
- 3.13 Geopolitical and trade dynamics
Chapter 4 Competitive Landscape, 2025
- 4.1 Introduction
- 4.2 Company market share analysis
- 4.2.1 By region
- 4.2.1.1 North America
- 4.2.1.2 Europe
- 4.2.1.3 Asia Pacific
- 4.2.1.4 Latin America
- 4.2.1.5 Middle East & Africa
- 4.2.2 Market concentration analysis
- 4.2.1 By region
- 4.3 Competitive benchmarking of key players
- 4.3.1 Financial performance comparison
- 4.3.1.1 Revenue
- 4.3.1.2 Profit margin
- 4.3.1.3 R&D
- 4.3.2 Product portfolio comparison
- 4.3.2.1 Product range breadth
- 4.3.2.2 Technology
- 4.3.2.3 Innovation
- 4.3.3 Geographic presence comparison
- 4.3.3.1 Global footprint analysis
- 4.3.3.2 Service network coverage
- 4.3.3.3 Market penetration by region
- 4.3.4 Competitive positioning matrix
- 4.3.4.1 Leaders
- 4.3.4.2 Challengers
- 4.3.4.3 Followers
- 4.3.4.4 Niche players
- 4.3.5 Strategic outlook matrix
- 4.3.1 Financial performance comparison
- 4.4 Key developments
- 4.4.1 Mergers and acquisitions
- 4.4.2 Partnerships and collaborations
- 4.4.3 Technological advancements
- 4.4.4 Expansion and investment strategies
- 4.4.5 Digital transformation initiatives
- 4.5 Emerging/ startup competitors landscape
Chapter 5 Market Estimates and Forecast, By Sensor Type, 2022 - 2035 (USD Million & Units)
- 5.1 Key trends
- 5.2 Pressure sensors
- 5.3 Temperature sensors
- 5.4 Humidity sensors
- 5.5 Gas sensors
- 5.6 Noise & acoustic sensors
- 5.7 Vibration & seismic sensors
- 5.8 Others
Chapter 6 Market Estimates and Forecast, By Type, 2022 - 2035 (USD Million & Units)
- 6.1 Key trends
- 6.2 Fixed/stationary sensors
- 6.3 Portable/mobile sensors
Chapter 7 Market Estimates and Forecast, By Connectivity, 2022 - 2035 (USD Million & Units)
- 7.1 Key trends
- 7.2 Wired sensors
- 7.3 Wireless sensors
Chapter 8 Market Estimates and Forecast, By Application, 2022 - 2035 (USD Million & Units)
- 8.1 Key trends
- 8.2 Air quality monitoring
- 8.3 Water quality monitoring
- 8.4 Soil & land monitoring
- 8.5 Noise & vibration monitoring
- 8.6 Weather & meteorological monitoring
- 8.7 Others
Chapter 9 Market Estimates and Forecast, By End Use Industry, 2022 - 2035 (USD Million & Units)
- 9.1 Key trends
- 9.2 Industrial
- 9.2.1 Chemical manufacturing
- 9.2.2 Food & beverage processing
- 9.2.3 Pharmaceutical manufacturing
- 9.2.4 Metals & mining
- 9.2.5 Pulp & paper
- 9.2.6 Oil & gas
- 9.2.7 Others
- 9.3 Energy & utilities
- 9.3.1 Power generation
- 9.3.2 Water & wastewater treatment
- 9.3.3 Renewable energy facilities
- 9.3.4 Others
- 9.4 Smart cities & infrastructure
- 9.4.1 Urban air quality networks
- 9.4.2 Smart water systems
- 9.4.3 Traffic & transportation monitoring
- 9.4.4 Others
- 9.5 Building automation
- 9.5.1 Commercial buildings & offices
- 9.5.2 Residential buildings
- 9.5.3 Hospitals & healthcare facilities
- 9.5.4 Data centers
- 9.5.5 Others
- 9.6 Agriculture
- 9.6.1 Precision farming
- 9.6.2 Greenhouse & controlled agriculture
- 9.6.3 Livestock management
- 9.6.4 Aquaculture
- 9.7 Others
Chapter 10 Market Estimates and Forecast, By Region, 2022 - 2035 (USD Million & Units)
- 10.1 Key trends
- 10.2 North America
- 10.2.1 U.S.
- 10.2.2 Canada
- 10.3 Europe
- 10.3.1 Germany
- 10.3.2 UK
- 10.3.3 France
- 10.3.4 Spain
- 10.3.5 Italy
- 10.3.6 Netherlands
- 10.4 Asia Pacific
- 10.4.1 China
- 10.4.2 India
- 10.4.3 Japan
- 10.4.4 Australia
- 10.4.5 South Korea
- 10.5 Latin America
- 10.5.1 Brazil
- 10.5.2 Mexico
- 10.5.3 Argentina
- 10.6 Middle East and Africa
- 10.6.1 South Africa
- 10.6.2 Saudi Arabia
- 10.6.3 UAE
Chapter 11 Company Profiles
- 11.1 Global Key Players
- 11.1.1 ABB Ltd.
- 11.1.2 Honeywell International Inc.
- 11.1.3 Siemens AG
- 11.1.4 Texas Instruments Incorporated
- 11.2 Regional key players
- 11.2.1 North America
- 11.2.1.1 Analog Devices, Inc.
- 11.2.1.2 Emerson Electric Co.
- 11.2.1.3 TE Connectivity Ltd.
- 11.2.1.4 NXP Semiconductors
- 11.2.2 Asia Pacific
- 11.2.2.1 Murata Manufacturing Co., Ltd.
- 11.2.2.2 Omron Corporation
- 11.2.2.3 Renesas Electronics Corporation
- 11.2.3 Europe
- 11.2.3.1 ams-OSRAM AG
- 11.2.3.2 Bosch Sensortec GmbH
- 11.2.3.3 STMicroelectronics N.V.
- 11.2.3.4 Sensirion AG
- 11.2.1 North America
- 11.3 Niche Players/Disruptors
- 11.3.1 Amphenol Advanced Sensors
- 11.3.2 Hach Company
- 11.3.3 Vaisala
- 11.3.4 Zebra Technologies

