
PUBLISHER: Global Market Insights Inc. | PRODUCT CODE: 1928914

PUBLISHER: Global Market Insights Inc. | PRODUCT CODE: 1928914
Nitrogen Gas Market Opportunity, Growth Drivers, Industry Trend Analysis, and Forecast 2026 - 2035
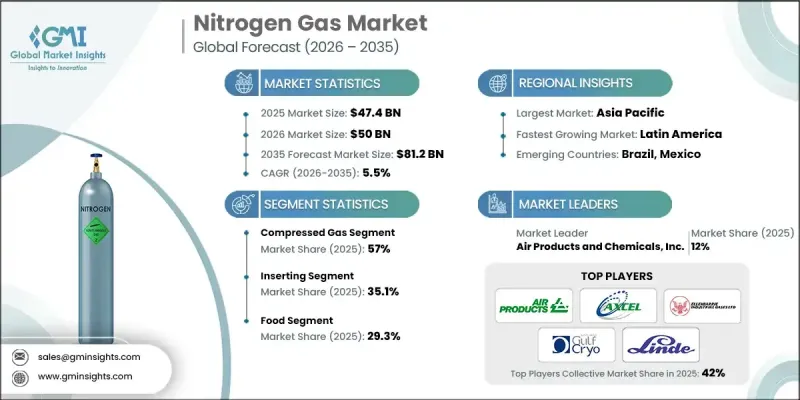
The Global Nitrogen Gas Market was valued at USD 47.4 billion in 2025 and is estimated to grow at a CAGR of 5.5% to reach USD 81.2 billion by 2035.
Growth is driven by rising production activity across energy-intensive industries, which has increased the use of nitrogen for inerting, blanketing, and process protection applications. Expanding output in advanced life science manufacturing has further supported demand, as nitrogen is widely used for controlled environments, preservation, and stabilization processes. High-purity nitrogen continues to see increased adoption in the storage of sensitive biological materials and in advanced therapeutic manufacturing workflows. The rapid expansion of electronics and semiconductor production has also contributed to higher consumption, as nitrogen plays a critical role in maintaining controlled atmospheres during fabrication. At the same time, producers are prioritizing improvements in energy efficiency and emissions reduction by enhancing air separation technologies and integrating cleaner power and heat sources. End users across heavy industries are increasingly shifting toward on-site generation systems and pipeline-based supply models, which improve supply reliability while lowering transportation-related emissions. These combined factors are reinforcing long-term market expansion across multiple industrial sectors.
| Market Scope | |
|---|---|
| Start Year | 2025 |
| Forecast Year | 2026-2035 |
| Start Value | $47.4 Billion |
| Forecast Value | $81.2 Billion |
| CAGR | 5.5% |
The compressed nitrogen segment accounted for 57% share in 2025 and is forecast to grow at a CAGR of 5.3% through 2035. Suppliers benefit from offering both compressed and liquid formats, as each supports different operational requirements. Compressed nitrogen is widely used in routine industrial processes delivered via cylinders, bundles, or bulk systems, while liquid nitrogen is essential for applications requiring rapid and high-intensity cooling and cryogenic performance.
The inserting segment held a 35.1% share in 2025 and is expected to grow at a CAGR of 14.8% from 2026 to 2035. Along with blanketing, purging, and related functions, nitrogen-based solutions are becoming standardized across multiple industries to enhance operational safety, reduce contamination risks, and meet increasingly strict quality and safety standards.
North America Nitrogen Gas Market segment reached USD 11.9 billion in 2025. This growth is supported by a diverse industrial base and mature infrastructure for pipeline distribution and on-site nitrogen generation, alongside rising activity in advanced manufacturing sectors.
Key companies active in the Global Nitrogen Gas Market include Linde PLC, Air Products and Chemicals, Inc., Praxair Technology, Inc., Messer Group, Yingde Gases Group, PARKER HANNIFIN CORP, Gulfcryo, Omega Air, Ellenbarrie Industrial Gases, Universal Industrial Gases, Inc., Southern Industrial Gas, and Axcel Gases. Companies operating in the Global Nitrogen Gas Market are strengthening their market positions through capacity expansion, infrastructure investment, and technology optimization. Many players are focusing on on-site generation solutions and long-term supply agreements to secure stable demand and improve customer retention. Investments in advanced air separation systems are helping reduce operating costs and environmental impact. Strategic partnerships and geographic expansion are used to improve market reach, while portfolio diversification across purity levels and delivery modes allows suppliers to address a broader range of industrial requirements and maintain competitive differentiation.
Table of Contents
Chapter 1 Methodology & Scope
- 1.1 Market scope and definition
- 1.2 Research design
- 1.2.1 Research approach
- 1.2.2 Data collection methods
- 1.3 Data mining sources
- 1.3.1 Global
- 1.3.2 Regional/Country
- 1.4 Base estimates and calculations
- 1.4.1 Base year calculation
- 1.4.2 Key trends for market estimation
- 1.5 Primary research and validation
- 1.5.1 Primary sources
- 1.6 Forecast model
- 1.7 Research assumptions and limitations
Chapter 2 Executive Summary
- 2.1 Industry 360° synopsis
- 2.2 Key market trends
- 2.2.1 Regional
- 2.2.2 Form
- 2.2.3 Application
- 2.2.4 End Use Industry
- 2.3 TAM Analysis, 2026-2035
- 2.4 CXO perspectives: Strategic imperatives
- 2.4.1 Executive decision points
- 2.4.2 Critical success factors
- 2.5 Future Outlook and Strategic Recommendations
Chapter 3 Industry Insights
- 3.1 Industry ecosystem analysis
- 3.1.1 Supplier landscape
- 3.1.2 Profit margin
- 3.1.3 Value addition at each stage
- 3.1.4 Factor affecting the value chain
- 3.1.5 Disruptions
- 3.2 Industry impact forces
- 3.2.1 Growth drivers
- 3.2.1.1 Rising industrial production and manufacturing output
- 3.2.1.2 Growth in food processing and cold-chain logistics
- 3.2.1.3 Expansion of pharma, biotech and semiconductor sectors
- 3.2.2 Industry pitfalls and challenges
- 3.2.2.1 High energy costs for air separation plants
- 3.2.2.2 On-site generation reducing bulk delivery volumes
- 3.2.3 Market opportunities
- 3.2.3.1 Adoption of green, low-carbon nitrogen production
- 3.2.3.2 Emerging market industrialisation and infrastructure
- 3.2.1 Growth drivers
- 3.3 Growth potential analysis
- 3.4 Regulatory landscape
- 3.4.1 North America
- 3.4.2 Europe
- 3.4.3 Asia Pacific
- 3.4.4 Latin America
- 3.4.5 Middle East & Africa
- 3.5 Porter';s analysis
- 3.6 PESTEL analysis
- 3.7 Price trends
- 3.7.1 By region
- 3.7.2 By form
- 3.8 Future market trends
- 3.9 Technology and Innovation landscape
- 3.9.1 Current technological trends
- 3.9.2 Emerging technologies
- 3.10 Patent Landscape
- 3.11 Trade statistics (HS code)
( Note: the trade statistics will be provided for key countries only)
- 3.11.1 Major importing countries
- 3.11.2 Major exporting countries
- 3.12 Sustainability and environmental aspects
- 3.12.1 Sustainable practices
- 3.12.2 Waste reduction strategies
- 3.12.3 Energy efficiency in production
- 3.12.4 Eco-friendly initiatives
- 3.13 Carbon footprint consideration
Chapter 4 Competitive Landscape, 2025
- 4.1 Introduction
- 4.2 Company market share analysis
- 4.2.1 By region
- 4.2.1.1 North America
- 4.2.1.2 Europe
- 4.2.1.3 Asia Pacific
- 4.2.1.4 LATAM
- 4.2.1.5 MEA
- 4.2.1 By region
- 4.3 Company matrix analysis
- 4.4 Competitive analysis of major market players
- 4.5 Competitive positioning matrix
- 4.6 Key developments
- 4.6.1 Mergers & acquisitions
- 4.6.2 Partnerships & collaborations
- 4.6.3 New Product Launches
- 4.6.4 Expansion Plans
Chapter 5 Market Estimates and Forecast, By Form, 2022-2035 (USD Billion) (Kilo Tons)
- 5.1 Key trends
- 5.2 Compressed gas
- 5.2.1 High-pressure cylinders
- 5.2.2 Bulk / tube trailers
- 5.2.3 On-site generated compressed nitrogen
- 5.3 Liquid nitrogen gas
- 5.3.1 Bulk storage tanks
- 5.3.2 Dewars / portable containers
- 5.3.3 On-site cryogenic plants
Chapter 6 Market Estimates and Forecast, By Application, 2022-2035 (USD Billion) (Kilo Tons)
- 6.1 Key trends
- 6.2 Inerting
- 6.2.1 Reactor and vessel inerting
- 6.2.2 Storage tank inerting
- 6.2.3 Pipeline inerting
- 6.3 Blanketing
- 6.3.1 Food and beverage headspace blanketing
- 6.3.2 Chemical and solvent tank blanketing
- 6.3.3 Oil and fuel storage blanketing
- 6.4 Welding & cutting
- 6.4.1 Metal welding shielding gas blends
- 6.4.2 Laser cutting and plasma cutting support
- 6.4.3 Heat treatment and brazing atmospheres
- 6.5 Purging
- 6.5.1 Pipeline and process line purging
- 6.5.2 Start-up and shutdown purging of equipment
- 6.5.3 Purging for maintenance and safety operations
- 6.6 Others
Chapter 7 Market Estimates and Forecast, By End Use Industry, 2022-2035 (USD Billion) (Kilo Tons)
- 7.1 Key trends
- 7.2 Cosmetics
- 7.3 Food
- 7.4 Automotive
- 7.5 Pharmaceutical
- 7.6 Others
Chapter 8 Market Estimates and Forecast, By Region, 2022-2035 (USD Billion) (Kilo Tons)
- 8.1 Key trends
- 8.2 North America
- 8.2.1 U.S.
- 8.2.2 Canada
- 8.3 Europe
- 8.3.1 Germany
- 8.3.2 UK
- 8.3.3 France
- 8.3.4 Spain
- 8.3.5 Italy
- 8.3.6 Rest of Europe
- 8.4 Asia Pacific
- 8.4.1 China
- 8.4.2 India
- 8.4.3 Japan
- 8.4.4 Australia
- 8.4.5 South Korea
- 8.4.6 Rest of Asia Pacific
- 8.5 Latin America
- 8.5.1 Brazil
- 8.5.2 Mexico
- 8.5.3 Argentina
- 8.5.4 Rest of Latin America
- 8.6 Middle East and Africa
- 8.6.1 Saudi Arabia
- 8.6.2 South Africa
- 8.6.3 UAE
- 8.6.4 Rest of Middle East and Africa
Chapter 9 Company Profiles
- 9.1 Air Products and Chemicals, Inc.
- 9.2 Axcel Gases
- 9.3 Ellenbarrie industrial Gases.
- 9.4 Gulfcryo
- 9.5 Linde PLC
- 9.6 Messer Group
- 9.7 Omega Air
- 9.8 PARKER HANNIFIN CORP
- 9.9 Praxair Technology, Inc.
- 9.10 Southern Industrial Gas
- 9.11 Universal Industrial Gases, Inc.
- 9.12 Yingde Gases Group

