
PUBLISHER: Global Market Insights Inc. | PRODUCT CODE: 1936563

PUBLISHER: Global Market Insights Inc. | PRODUCT CODE: 1936563
Non-Alcoholic Smart Beverages Machine Market Opportunity, Growth Drivers, Industry Trend Analysis, and Forecast 2026 - 2035
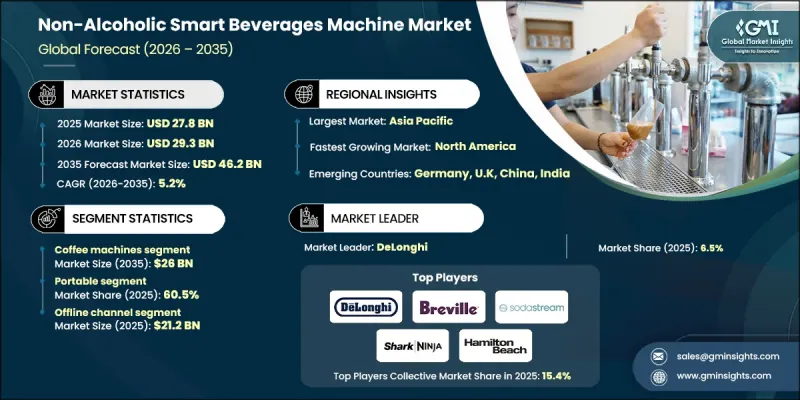
The Global Non-Alcoholic Smart Beverages Machine Market was valued at USD 27.8 billion in 2025 and is estimated to grow at a CAGR of 5.2% to reach USD 46.2 billion by 2035.
Growth is supported by increasing consumer interest in personalized beverage preparation and automated drink solutions. Smart beverage machines allow users to customize flavor profiles, sweetness intensity, and beverage composition, aligning well with modern expectations for tailored consumption experiences. Rising health awareness is also influencing purchasing behavior, with consumers favoring beverages that incorporate natural ingredients, functional additives, and enhanced nutritional profiles. Younger demographics demonstrate a strong interest in connected and technology-enabled appliances, further encouraging their adoption. However, manufacturers face challenges related to high development costs and the technical complexity of integrating advanced hardware with intelligent software platforms. Developing these systems requires significant financial investment, engineering expertise, and long-term innovation strategies. Despite these barriers, ongoing advancements in smart appliance technology and increasing demand for convenience-driven solutions continue to support long-term market expansion across both residential and commercial environments.
| Market Scope | |
|---|---|
| Start Year | 2025 |
| Forecast Year | 2026-2035 |
| Start Value | $27.8 Billion |
| Forecast Value | $46.2 Billion |
| CAGR | 5.2% |
The coffee machines segment generated USD 15.3 billion in 2025 and is expected to reach USD 26 billion by 2035. This segment leads the market due to strong global demand for coffee and growing preference for specialty beverage preparation. Automated brewing, remote operation, and customizable settings enhance user convenience and contribute to widespread adoption, particularly in urban areas where coffee consumption continues to rise.
The portable smart beverage machines segment accounted for 60.5% share in 2025. Demand for portable models is driven by their ease of use, space-saving design, and suitability for fast-paced lifestyles. Urban living conditions and limited household space further support demand for compact and easily stored devices that offer flexibility without compromising functionality.
The offline distribution channel generated USD 21.2 billion in revenue in 2025 and maintained the largest share of the market. Physical retail locations continue to attract consumers who prefer to assess product quality, functionality, and design in person before purchasing. This hands-on evaluation strengthens buyer confidence and remains a key factor supporting offline sales performance.
US Non-Alcoholic Smart Beverages Machine Market accounted for 83.5% share in 2025. Strong purchasing power, widespread adoption of connected home appliances, and increasingly automated lifestyles continue to drive growth. The country benefits from rapid technology adoption across both household and commercial settings, reinforcing its leadership position within the region.
Key companies operating in the Global Non-Alcoholic Smart Beverages Machine Market include Breville, SodaStream, SharkNinja, DeLonghi, Hamilton Beach, Mr. Coffee, Cuisinart, Smarter, Wonderchef, Aicook, IFB Appliances, Nebula, Isoda, Omega, Cold Press, and Moccamaster. Companies in the non-alcoholic smart beverages machine market strengthen their market position by focusing on product innovation, enhanced customization features, and smart connectivity integration. Many manufacturers invest in user-friendly interfaces, mobile app compatibility, and energy-efficient designs to improve consumer appeal. Expanding product portfolios across price points helps brands reach broader customer segments. Strategic partnerships with retail distributors and lifestyle brands support visibility and market penetration. Firms also emphasize design aesthetics and compact form factors to suit urban households.
Table of Contents
Chapter 1 Methodology & Scope
- 1.1 Market scope and definition
- 1.2 Research design
- 1.2.1 Research approach
- 1.2.2 Data collection methods
- 1.3 Data mining sources
- 1.3.1 Global
- 1.3.2 Regional/Country
- 1.4 Base estimates and calculations
- 1.4.1 Base year calculation
- 1.4.2 Key trends for market estimation
- 1.5 Primary research and validation
- 1.5.1 Primary sources
- 1.6 Forecast model
- 1.7 Research assumptions and limitations
Chapter 2 Executive Summary
- 2.1 Industry 3600 synopsis
- 2.2 Key market trends
- 2.2.1 Regional
- 2.2.2 Product Type
- 2.2.3 Category
- 2.2.4 Price
- 2.2.5 End Use
- 2.2.6 Distribution channel
- 2.3 CXO perspectives: Strategic imperatives
- 2.3.1 Key decision points for industry executives
- 2.3.2 Critical success factors for market players
- 2.4 Future outlook and strategic recommendations
Chapter 3 Industry Insights
- 3.1 Industry ecosystem analysis
- 3.1.1 Supplier landscape
- 3.1.2 Profit margin
- 3.1.3 Value addition at each stage
- 3.1.4 Factor affecting the value chain
- 3.2 Industry impact forces
- 3.2.1 Growth drivers
- 3.2.1.1 Smart technology integration
- 3.2.1.2 Growing numbers of household and restaurants across the world
- 3.2.1.3 Growing disposable income and change in the standard of living
- 3.2.2 Industry pitfalls & challenges
- 3.2.2.1 Availability of counterfeit products
- 3.2.2.2 Easy availability of substitute products
- 3.2.3 Opportunities
- 3.2.3.1 Expansion into health-focused, personalized beverage solutions.
- 3.2.3.2 Growth in connected, IoT-enabled machines for residential and commercial segments
- 3.2.1 Growth drivers
- 3.3 Growth potential analysis
- 3.4 Future market trends
- 3.5 Technology and innovation landscape
- 3.5.1 Current technological trends
- 3.5.2 Emerging technologies
- 3.6 Price trends
- 3.6.1 By Product type
- 3.6.2 By Region
- 3.7 Regulatory landscape
- 3.7.1 Standards and compliance requirements
- 3.7.2 Regional regulatory frameworks
- 3.7.3 Certification standards
- 3.8 Trade statistics
- 3.8.1 Major importing countries
- 3.8.2 Major exporting countries
- 3.9 Gap analysis
- 3.10 Risk assessment and mitigation
- 3.11 Porter's analysis
- 3.12 PESTEL analysis
- 3.13 Consumer behaviour analysis
- 3.13.1 Purchasing patterns
- 3.13.2 Preference analysis
- 3.13.3 Regional variations in consumer behaviour
- 3.13.4 Impact of e-commerce on buying decisions
Chapter 4 Competitive Landscape, 2025
- 4.1 Introduction
- 4.2 Company market share analysis
- 4.2.1 By Region
- 4.2.1.1 North America
- 4.2.1.2 Europe
- 4.2.1.3 Asia Pacific
- 4.2.1.4 Latin America
- 4.2.1.5 Middle East and Africa
- 4.2.1 By Region
- 4.3 Company matrix analysis
- 4.4 Competitive analysis of major market players
- 4.5 Competitive positioning matrix
- 4.6 Key developments
- 4.6.1 Mergers & acquisitions
- 4.6.2 Partnerships & collaborations
- 4.6.3 New product launches
- 4.6.4 Expansion plans
Chapter 5 Market Estimates & Forecast, By Product Type, 2022-2035 (USD Billion) (Thousand Units)
- 5.1 Key trends
- 5.2 Soda Machine
- 5.3 Coffee Machine
- 5.3.1 Espresso Machines
- 5.3.2 Drip Coffee Makers
- 5.3.3 Pod Machines
- 5.4 Juice/ Soft Drink Machine
- 5.5 Others (Water Maker Machine, etc.)
Chapter 6 Market Estimates & Forecast, By Category, 2022-2035 (USD Billion) (Thousand Units)
- 6.1 Key trends
- 6.2 Countertop
- 6.3 Portable
Chapter 7 Market Estimates & Forecast, By Price, 2022-2035 (USD Billion) (Thousand Units)
- 7.1 Key trends
- 7.2 Low
- 7.3 Medium
- 7.4 High
Chapter 8 Market Estimates & Forecast, By End Use, 2022-2035 (USD Billion) (Thousand Units)
- 8.1 Key trends
- 8.2 Residential
- 8.3 Commercial
- 8.3.1 Hotels
- 8.3.2 Restaurants
- 8.3.3 Others
Chapter 9 Market Estimates & Forecast, By Distribution Channel, 2022-2035 (USD Billion) (Thousand Units)
- 9.1 Key trends
- 9.2 Online channels
- 9.2.1 Ecommerce
- 9.2.2 Company Owned Website
- 9.3 Offline Channels
- 9.3.1 Specialty Stores
- 9.3.2 Mega Retail stores
- 9.3.3 Others
Chapter 10 Market Estimates & Forecast, By Region, 2022-2035 (USD Billion) (Thousand Units)
- 10.1 Key trends
- 10.2 North America
- 10.2.1 U.S.
- 10.2.2 Canada
- 10.3 Europe
- 10.3.1 Germany
- 10.3.2 France
- 10.3.3 UK
- 10.3.4 Italy
- 10.3.5 Spain
- 10.4 Asia Pacific
- 10.4.1 China
- 10.4.2 India
- 10.4.3 Japan
- 10.4.4 South Korea
- 10.4.5 Australia
- 10.5 Latin America
- 10.5.1 Brazil
- 10.5.2 Mexico
- 10.5.3 Argentina
- 10.6 MEA
- 10.6.1 South Africa
- 10.6.2 Saudi Arabia
- 10.6.3 UAE
Chapter 11 Company Profiles
- 11.1 Aicook
- 11.2 Breville
- 11.3 Cuisinart
- 11.4 DeLonghi
- 11.5 Hamilton Beach
- 11.6 IFB Appliances
- 11.7 Isoda
- 11.8 Moccamaster
- 11.9 Mr. Coffee
- 11.10 Nebula
- 11.11 Omega and Cold Press
- 11.12 SharkNinja
- 11.13 Smarter
- 11.14 SodaStream
- 11.15 Wonderchef

