
PUBLISHER: Global Market Insights Inc. | PRODUCT CODE: 1936677

PUBLISHER: Global Market Insights Inc. | PRODUCT CODE: 1936677
Paraffin Inhibitors Market Opportunity, Growth Drivers, Industry Trend Analysis, and Forecast 2026 - 2035
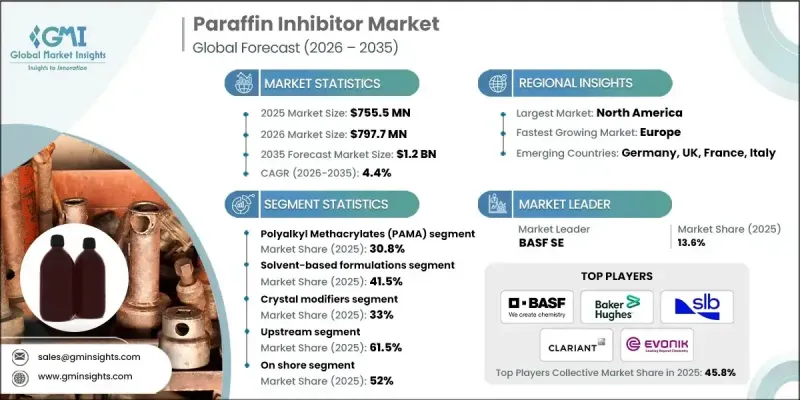
The Global Paraffin Inhibitors Market was valued at USD 755.5 million in 2025 and is estimated to grow at a CAGR of 4.4% to reach USD 1.2 billion by 2035.
Market expansion is tied to the steady increase in upstream oil and gas exploration and production activities worldwide. Paraffin inhibitors play a critical role in maintaining uninterrupted flow by limiting wax formation within pipelines and production equipment, which helps prevent blockages and operational inefficiencies. As crude oil output continues to rise, demand for effective flow assurance solutions is increasing. These chemicals work by disrupting wax crystallization, reducing adhesion to pipeline surfaces, and supporting stable transport conditions. Their use results in lower maintenance requirements, reduced downtime, improved operational reliability, and extended asset life. Paraffin inhibitors are suitable for a wide range of crude compositions and are designed to perform under varying temperature and pressure conditions. Ongoing market development is increasingly focused on environmentally responsible formulations, driven by tightening environmental regulations and industry demand for reduced chemical consumption with enhanced performance.
| Market Scope | |
|---|---|
| Start Year | 2025 |
| Forecast Year | 2026-2035 |
| Start Value | $755.5 Million |
| Forecast Value | $1.2 Billion |
| CAGR | 4.4% |
The polyalkyl methacrylates segment accounted for 30.8% share in 2025 and is expected to grow at a CAGR of 4.3% through 2035. These inhibitors are widely adopted due to their strong wax solubility and thermal stability, making them suitable for demanding operating environments. Market innovation is increasingly centered on improving biodegradability and reducing environmental impact while maintaining performance efficiency.
The solvent-based formulations segment held 41.5% share in 2025 and is forecast to grow at a CAGR of 4% from 2026 to 2035. These formulations remain popular due to their rapid action and proven effectiveness in wax control. However, manufacturers are adapting formulations to align with stricter environmental and safety requirements by lowering emissions and improving sustainability while retaining suitability for high-temperature and heavy-duty applications.
North America Paraffin Inhibitors Market accounted for 25.8% share in 2025 and continues to experience strong growth. Regional demand is supported by active exploration programs, mature production assets, and challenging operating conditions that require advanced wax management solutions. Environmental policy frameworks are also encouraging the development and adoption of biodegradable inhibitor technologies, contributing to sustained market momentum.
Key companies operating in the Global Paraffin Inhibitors Market include BASF SE, Baker Hughes, Arkema, Clariant, ChampionX, Evonik Industries, Nouryon, BYK, SI Group, Inc., and SLB. Companies in the paraffin inhibitors market are strengthening their market position by investing in advanced chemical formulations that enhance performance while meeting environmental standards. Manufacturers are prioritizing biodegradable and low-toxicity solutions to align with regulatory expectations and sustainability goals. Strategic collaborations with oilfield service providers and energy producers are expanding market reach and improving product integration. Firms are also focusing on optimizing dosage efficiency to reduce operating costs for end users. Capacity expansions, regional production optimization, and long-term supply agreements are being used to ensure consistent availability. Continued investment in research and field testing is helping companies improve reliability, adapt products to diverse operating conditions, and maintain a competitive edge.
Table of Contents
Chapter 1 Methodology & Scope
- 1.1 Market scope and definition
- 1.2 Research design
- 1.2.1 Research approach
- 1.2.2 Data collection methods
- 1.3 Data mining sources
- 1.3.1 Global
- 1.3.2 Regional/Country
- 1.4 Base estimates and calculations
- 1.4.1 Base year calculation
- 1.4.2 Key trends for market estimation
- 1.5 Primary research and validation
- 1.5.1 Primary sources
- 1.6 Forecast model
- 1.7 Research assumptions and limitations
Chapter 2 Executive Summary
- 2.1 Industry 3600 synopsis
- 2.2 Key market trends
- 2.2.1 Regional
- 2.2.2 Chemistry type
- 2.2.3 Formulation type
- 2.2.4 Function
- 2.2.5 Operation
- 2.2.6 Application
- 2.3 TAM Analysis, 2026-2035
- 2.4 CXO perspectives: Strategic imperatives
- 2.4.1 Executive decision points
- 2.4.2 Critical success factors
- 2.5 Future Outlook and Strategic Recommendations
Chapter 3 Industry Insights
- 3.1 Industry ecosystem analysis
- 3.1.1 Supplier landscape
- 3.1.2 Profit margin
- 3.1.3 Value addition at each stage
- 3.1.4 Factor affecting the value chain
- 3.1.5 Disruptions
- 3.2 Industry impact forces
- 3.2.1 Growth drivers
- 3.2.2 Industry pitfalls and challenges
- 3.2.3 Market opportunities
- 3.3 Growth potential analysis
- 3.4 Regulatory landscape
- 3.4.1 North America
- 3.4.2 Europe
- 3.4.3 Asia Pacific
- 3.4.4 Latin America
- 3.4.5 Middle East & Africa
- 3.5 Porter's analysis
- 3.6 PESTEL analysis
- 3.7 Price trends
- 3.7.1 By region
- 3.7.2 By type
- 3.8 Future market trends
- 3.9 Technology and Innovation landscape
- 3.9.1 Current technological trends
- 3.9.2 Emerging technologies
- 3.10 Patent Landscape
- 3.11 Trade statistics (HS code) ( Note: the trade statistics will be provided for key countries only)
- 3.11.1 Major importing countries
- 3.11.2 Major exporting countries
- 3.12 Sustainability and environmental aspects
- 3.12.1 Sustainable practices
- 3.12.2 Waste reduction strategies
- 3.12.3 Energy efficiency in production
- 3.12.4 Eco-friendly initiatives
- 3.13 Carbon footprint consideration
Chapter 4 Competitive Landscape, 2025
- 4.1 Introduction
- 4.2 Company market share analysis
- 4.2.1 By region
- 4.2.1.1 North America
- 4.2.1.2 Europe
- 4.2.1.3 Asia Pacific
- 4.2.1.4 LATAM
- 4.2.1.5 MEA
- 4.2.1 By region
- 4.3 Company matrix analysis
- 4.4 Competitive analysis of major market players
- 4.5 Competitive positioning matrix
- 4.6 Key developments
- 4.6.1 Mergers & acquisitions
- 4.6.2 Partnerships & collaborations
- 4.6.3 New Product Launches
- 4.6.4 Expansion Plans
Chapter 5 Market Estimates and Forecast, By Chemistry Type, 2022-2035 (USD Million) (Kilo Tons)
- 5.1 Key trends
- 5.2 Polyalkyl methacrylates (PAMA)
- 5.3 Ethylene-vinyl acetate (EVA) copolymers
- 5.4 Polyacrylates & alkyl acrylate copolymers
- 5.5 Modified polycarboxylates
- 5.6 Hyperbranched polyester
- 5.7 Others
Chapter 6 Market Estimates and Forecast, By Formulation Type, 2022-2035 (USD Million) (Kilo Tons)
- 6.1 Key trends
- 6.2 Solvent-based formulations
- 6.3 Oil-soluble
- 6.4 Aqueous-based/water-dispersible
- 6.5 Solid/controlled-release formulations
Chapter 7 Market Estimates and Forecast, By Function, 2022-2035 (USD Million) (Kilo Tons)
- 7.1 Key trends
- 7.2 Crystal modifiers
- 7.3 Paraffin dispersants
- 7.4 Flow improvers
- 7.5 Pour point depressants
- 7.6 Viscosity reducers
Chapter 8 Market Estimates and Forecast, By Operation, 2022-2035 (USD Million) (Kilo Tons)
- 8.1 Key trends
- 8.2 Upstream
- 8.3 Midstream
- 8.4 Downstream
Chapter 9 Market Estimates and Forecast, By Application, 2022-2035 (USD Million) (Kilo Tons)
- 9.1 Key trends
- 9.2 Onshore
- 9.3 Offshore
Chapter 10 Market Estimates and Forecast, By Region, 2022-2035 (USD Million) (Kilo Tons)
- 10.1 Key trends
- 10.2 North America
- 10.2.1 U.S.
- 10.2.2 Canada
- 10.3 Europe
- 10.3.1 Germany
- 10.3.2 UK
- 10.3.3 France
- 10.3.4 Spain
- 10.3.5 Italy
- 10.3.6 Rest of Europe
- 10.4 Asia Pacific
- 10.4.1 China
- 10.4.2 India
- 10.4.3 Japan
- 10.4.4 Australia
- 10.4.5 South Korea
- 10.4.6 Rest of Asia Pacific
- 10.5 Latin America
- 10.5.1 Brazil
- 10.5.2 Mexico
- 10.5.3 Argentina
- 10.5.4 Rest of Latin America
- 10.6 Middle East and Africa
- 10.6.1 Saudi Arabia
- 10.6.2 South Africa
- 10.6.3 UAE
- 10.6.4 Rest of Middle East and Africa
Chapter 11 Company Profiles
- 11.1 Arkema
- 11.2 Baker Hughes
- 11.3 BASF SE
- 11.4 BYK
- 11.5 ChampionX
- 11.6 Clariant
- 11.7 Evonik Industries
- 11.8 Nouryon
- 11.9 SI Group, Inc.
- 11.10 SLB

