
PUBLISHER: Global Market Insights Inc. | PRODUCT CODE: 1959281

PUBLISHER: Global Market Insights Inc. | PRODUCT CODE: 1959281
Industrial Pressure Sensor with IoT Market Opportunity, Growth Drivers, Industry Trend Analysis, and Forecast 2026 - 2035
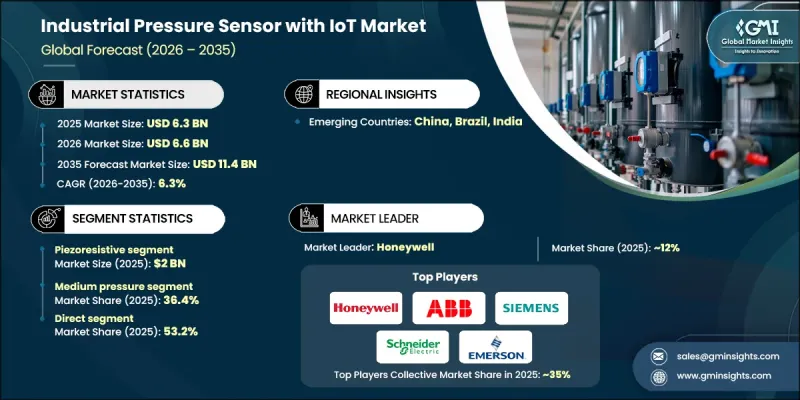
The Global Industrial Pressure Sensor with IoT Market was valued at USD 6.3 billion in 2025 and is estimated to grow at a CAGR of 6.3% to reach USD 11.4 billion by 2035.
Growth is driven by the integration of connected pressure-sensing technologies into automated production environments, where uninterrupted data collection and analysis support continuous operations. Smart pressure sensors enable real-time monitoring and data-driven decision-making without disrupting manufacturing workflows. Their ability to support predictive maintenance significantly lowers the risk of unexpected equipment failure, allowing manufacturers to optimize production planning and inventory management. These sensors are designed to operate as native components within digitally connected factories, accelerating the transition toward fully automated and intelligent production systems. Enhanced measurement accuracy and consistency allow manufacturers to maintain tighter process control, improve output quality, minimize material loss, and achieve higher levels of efficiency. As Industry 4.0 adoption deepens, IoT-enabled pressure sensors are becoming essential tools for achieving operational resilience and long-term productivity gains.
| Market Scope | |
|---|---|
| Start Year | 2025 |
| Forecast Year | 2026-2035 |
| Start Value | $6.3 Billion |
| Forecast Value | $11.4 Billion |
| CAGR | 6.3% |
The piezoresistive segment generated USD 2 billion in 2025 and is expected to grow at a CAGR of 5.8% from 2026 to 2035. This technology leads the market due to its strong sensitivity, stable performance, and consistent measurement accuracy in demanding operating conditions. Piezoresistive sensors are widely selected for applications that require dependable pressure monitoring and long-term reliability, supporting their continued adoption as IoT integration expands across industrial environments.
The medium pressure segment accounted for 36.4% share in 2025 and is forecast to grow at a CAGR of 6.8% through 2035. Sensors in this range address a broad spectrum of operational requirements by offering an effective balance between performance, precision, and system durability. Their cost efficiency and reliable functionality make them a preferred option for applications that demand consistent pressure control without excessive system complexity.
U.S. Industrial Pressure Sensor with IoT Market generated USD 1.1 billion in 2025 and is projected to grow at a CAGR of 5.9% from 2026 to 2035. Market leadership is supported by strong investment in smart manufacturing and early adoption of advanced digital technologies. A well-established industrial base and rigorous operational standards continue to drive demand for connected pressure sensing solutions that deliver accuracy, safety, and efficiency.
Key companies operating in the Global Industrial Pressure Sensor with IoT Market include Siemens AG, Honeywell International Inc., Schneider Electric, ABB Ltd., Yokogawa Electric Corp., Emerson Electric, TE Connectivity, Rockwell Automation, AMETEK Inc., Omron Corporation, Endress+Hauser Group, TDK Corporation, Murata Manufacturing Co., Ltd., Baumer Group, and Bosch Sensortec. Companies in the industrial pressure sensor with IoT market focus on innovation, system integration, and global expansion to strengthen their market position. Many invest in advanced sensor design to enhance accuracy, durability, and data reliability. Integration with digital platforms and analytics tools is prioritized to support predictive maintenance and real-time monitoring. Strategic partnerships help expand solution ecosystems and improve interoperability. Manufacturers also emphasize compliance with industrial standards and cybersecurity requirements to build customer confidence.
Table of Contents
Chapter 1 Methodology & Scope
- 1.1 Market scope & definitions
- 1.2 Research design
- 1.2.1 Research approach
- 1.2.2 Data collection methods
- 1.3 Base estimates and calculations
- 1.3.1 Base year calculation
- 1.3.2 Market estimates & forecasts parameters
- 1.4 Forecast Model
- 1.4.1 Key trends for market estimates
- 1.4.2 Quantified market impact analysis
- 1.4.2.1 Mathematical impact of growth parameters on forecast
- 1.4.3 Scenario analysis framework
- 1.5 Primary research and validation
- 1.5.1 Some of the primary sources (but not limited to)
- 1.6 Data mining sources
- 1.6.1 Paid Sources
- 1.7 Research Trail & confidence scoring
- 1.7.1 Research trail components
- 1.7.2 Scoring components
- 1.8 Research transparency addendum
- 1.8.1 Source attribution framework
- 1.8.2 Quality assurance metrics
- 1.8.3 Our commitment to trust
- 1.9 Market Definitions
Chapter 2 Executive Summary
- 2.1 Industry 360° synopsis
- 2.2 Key market trends
- 2.2.1 Regional
- 2.2.2 Sensor type
- 2.2.3 Pressure range
- 2.2.4 Application
- 2.2.5 End user industry
- 2.2.6 Distribution channel
- 2.3 CXO perspectives: Strategic imperatives
- 2.3.1 Key decision points for industry executives
- 2.3.2 Critical success factors for market players
- 2.4 Future outlook and strategic recommendations
Chapter 3 Industry Insights
- 3.1 Industry ecosystem analysis
- 3.1.1 Supplier landscape
- 3.1.2 Profit margin
- 3.1.3 Value addition at each stage
- 3.1.4 Factor affecting the value chain
- 3.2 Industry impact forces
- 3.2.1 Growth drivers
- 3.2.1.1 Industry 4.0 adoption
- 3.2.1.2 Energy efficiency & safety regulations
- 3.2.1.3 Integration with cloud & ai analytics
- 3.2.2 Pitfalls & Challenges
- 3.2.2.1 High initial cost & integration complexity
- 3.2.2.2 Cybersecurity risks
- 3.2.3 Opportunities
- 3.2.3.1 Emerging smart infrastructure projects
- 3.2.3.2 Advancements in wireless & low-power technologies
- 3.2.1 Growth drivers
- 3.3 Growth potential analysis
- 3.4 Future market trends
- 3.5 Technology and innovation landscape
- 3.5.1 Current technological trends
- 3.5.2 Emerging technologies
- 3.6 Price trends
- 3.6.1 By region
- 3.6.2 By product
- 3.7 Regulatory landscape
- 3.7.1 North America
- 3.7.1.1 US: Consumer Product Safety Commission (CPSC) 16 Code of Federal Regulations (CFR) part 1512
- 3.7.1.2 Canada: International Organization for Standardization (ISO) 4210
- 3.7.2 Europe
- 3.7.2.1 Germany: Deutsches Institut fur Normung (DIN) European Norm (EN) ISO 4210
- 3.7.2.2 UK: European Norm (EN) ISO 4210 / United Kingdom Conformity Assessed (UKCA)
- 3.7.2.3 France: European Norm (EN) ISO 4210
- 3.7.3 Asia Pacific
- 3.7.3.1 China: Guobiao (GB) 3565
- 3.7.3.2 India: Indian Standard (IS) 10613
- 3.7.3.3 Japan: Japanese Industrial Standard (JIS) D 9110
- 3.7.4 Latin America
- 3.7.4.1 Brazil: Associacao Brasileira de Normas Tecnicas (ABNT) Norma Brasileira (NBR) ISO 4210
- 3.7.4.2 Mexico: International Organization for Standardization (ISO) 4210
- 3.7.5 Middle East & Africa
- 3.7.5.1 South Africa: South African National Standard (SANS) 311
- 3.7.5.2 Saudi Arabia: Saudi Standards, Metrology and Quality Organization (SASO) Gulf Standardization Organization (GSO) ISO 4210
- 3.7.1 North America
- 3.8 Trade statistics (HS code- 9026.20)
- 3.8.1 Major importing countries
- 3.8.2 Major exporting countries
- 3.9 Porter’s analysis
- 3.10 PESTEL analysis
Chapter 4 Competitive Landscape, 2025
- 4.1 Introduction
- 4.2 Company market share analysis
- 4.2.1 By Region
- 4.2.1.1 North America
- 4.2.1.2 Europe
- 4.2.1.3 Asia Pacific
- 4.2.1.4 Latin America
- 4.2.1.5 Middle East & Africa
- 4.2.1 By Region
- 4.3 Company matrix analysis
- 4.4 Competitive analysis of major market players
- 4.5 Competitive positioning matrix
- 4.6 Key developments
- 4.6.1 Mergers & acquisitions
- 4.6.2 Partnerships & collaborations
- 4.6.3 New product launches
- 4.6.4 Expansion plans
Chapter 5 Market Estimates & Forecast, By Sensor Type, 2022 - 2035, (USD Billion) (Thousand Units)
- 5.1 Key trends
- 5.2 Piezoresistive
- 5.3 Capacitive
- 5.4 Resonant
- 5.5 Optical
- 5.6 Electromagnetic
- 5.7 Piezoelectric
Chapter 6 Market Estimates & Forecast, By Pressure Range, 2022 - 2035, (USD Billion) (Thousand units)
- 6.1 Key trends
- 6.2 Low Pressure (less than 1,000 psi)
- 6.3 Medium Pressure (1,000-10,000 psi)
- 6.4 High Pressure (more than 10,000 psi)
Chapter 7 Market Estimates & Forecast, By Application, 2022 - 2035, (USD Billion) (Thousand units)
- 7.1 Key trends
- 7.2 Process monitoring & control
- 7.3 Predictive maintenance
- 7.4 Leak detection
- 7.5 Level measurement
- 7.6 Flow measurement
- 7.7 Hvac systems
- 7.8 Hydraulic/pneumatic systems
- 7.9 Environmental monitoring
Chapter 8 Market Estimates & Forecast, By End User Industry, 2022 - 2035, (USD Billion) (Thousand units)
- 8.1 Key trends
- 8.2 Commercial farms
- 8.3 Oil & gas
- 8.4 Manufacturing
- 8.5 Automotive
- 8.6 Pharmaceuticals
- 8.7 Food and beverages
- 8.8 Water & wastewater
- 8.9 Power generation
- 8.10 Chemicals
- 8.11 Aerospace & defense
Chapter 9 Market Estimates & Forecast, By Distribution Channel, 2022 - 2035, (USD Billion) (Thousand Units)
- 9.1 Key trends
- 9.2 Direct
- 9.3 Indirect
Chapter 10 Market Estimates & Forecast, By Region, 2022 - 2035, (USD Billion) (Thousand Units)
- 10.1 Key trends
- 10.2 North America
- 10.2.1 U.S.
- 10.2.2 Canada
- 10.3 Europe
- 10.3.1 Germany
- 10.3.2 UK
- 10.3.3 France
- 10.3.4 Italy
- 10.3.5 Spain
- 10.4 Asia Pacific
- 10.4.1 China
- 10.4.2 India
- 10.4.3 Japan
- 10.4.4 South Korea
- 10.4.5 Australia
- 10.5 Latin America
- 10.5.1 Brazil
- 10.5.2 Mexico
- 10.5.3 Argentina
- 10.6 MEA
- 10.6.1 Saudi Arabia
- 10.6.2 UAE
- 10.6.3 South Africa
Chapter 11 Company Profiles
- 11.1 ABB Ltd.
- 11.2 AMETEK Inc.
- 11.3 Baumer Group
- 11.4 Bosch Sensortec
- 11.5 Emerson Electric
- 11.6 Endress+Hauser Group
- 11.7 Honeywell International Inc.
- 11.8 Murata Manufacturing Co., Ltd.
- 11.9 Omron Corporation
- 11.10 Rockwell Automation
- 11.11 Schneider Electric
- 11.12 Siemens AG
- 11.13 TDK Corporation
- 11.14 TE Connectivity
- 11.15 Yokogawa Electric Corp.

