
PUBLISHER: Global Market Insights Inc. | PRODUCT CODE: 1959581

PUBLISHER: Global Market Insights Inc. | PRODUCT CODE: 1959581
Optical Sensors Market Opportunity, Growth Drivers, Industry Trend Analysis, and Forecast 2026 - 2035
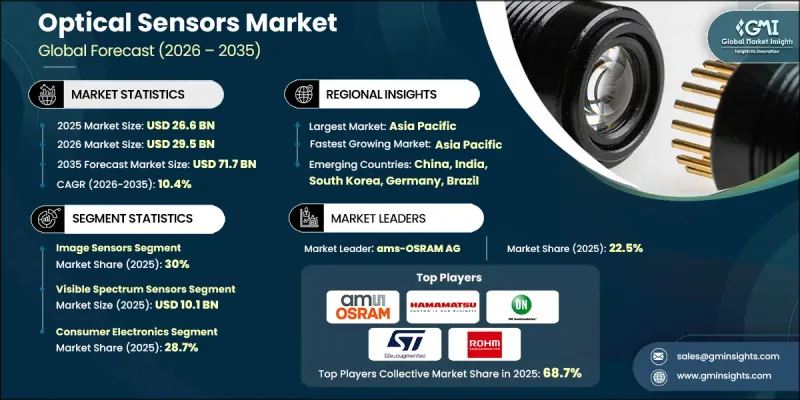
The Global Optical Sensors Market was valued at USD 26.6 billion in 2025 and is estimated to grow at a CAGR of 10.4% to reach USD 71.7 billion by 2035.
The market expansion is driven by the rising adoption of optical sensors in wearable health monitoring devices, coupled with their increasing use in imaging and medical diagnostic applications. Demand is further supported by the need for precise environmental and gas monitoring in industrial and commercial operations, along with the growth of smart factories that rely on photoelectric sensing for automation, quality inspection, and safety compliance. Fiber-optic sensing is also gaining traction in energy and infrastructure monitoring, offering long-distance, high-sensitivity measurement capabilities. This trend accelerated after 2020 with grid modernization and the expansion of renewable energy, and it is expected to continue through 2030, as utilities focus on real-time fault detection, structural health monitoring, and reducing downtime and maintenance risks. Standardization and safety compliance are increasingly shaping adoption strategies in regulated sectors, driving interoperability, faster approvals, and trust in optical sensing technologies.
| Market Scope | |
|---|---|
| Start Year | 2025 |
| Forecast Year | 2026-2035 |
| Start Value | $26.6 Billion |
| Forecast Value | $71.7 Billion |
| CAGR | 10.4% |
The image sensors segment held 30% share in 2025, leading due to its wide application in consumer electronics, automotive camera systems, industrial machine vision, and medical imaging. Image sensors provide high-resolution visual data, support AI-driven analytics, and integrate seamlessly with digital processing platforms, making them essential for applications requiring precision and real-time visual intelligence.
The visible spectrum sensors segment reached USD 10.1 billion in 2025. These sensors remain in strong demand due to compatibility with standard imaging systems, cost-effective production, and suitability for large-scale applications across consumer electronics, industrial inspection, and machine vision systems.
North America Optical Sensors Market accounted for 27% share in 2025. Growth in this region is fueled by rising adoption of advanced driver assistance systems, healthcare diagnostics, and automation in industrial manufacturing. Demand is strongest in the automotive, semiconductor, and medical device sectors, driving deployment of high-precision image sensors, LiDAR, and photoelectric sensors. Investments by governments and private companies in smart mobility, digital healthcare, and Industry 4.0 initiatives are also boosting market growth, as these projects depend on optical sensors for accurate, real-time data acquisition and process control.
Prominent players in the Global Optical Sensors Market include Keyence Corporation, Panasonic Corporation, Broadcom Inc., ams-OSRAM AG, Texas Instruments Incorporated, SICK AG, Honeywell International Inc., ROHM Co., Ltd., Sony Group Corporation, Jenoptik AG, ON Semiconductor Corp., Rockley Photonics Holdings Ltd., TE Connectivity Ltd., SiLC Technologies, Inc., Hamamatsu Photonics K.K., and STMicroelectronics N.V. Key strategies adopted by optical sensor companies include expanding product portfolios to cover diverse applications, from automotive and industrial to medical devices. Firms focus on high-precision and energy-efficient solutions while emphasizing interoperability with existing systems. Companies invest in R&D to develop next-generation sensors with higher sensitivity, smaller form factors, and AI integration. Strategic partnerships, collaborations, and mergers help access new markets and technologies. Market leaders optimize manufacturing capabilities to meet high-volume demand and reduce costs. Emphasis on regulatory compliance, certifications, and standardization improves adoption in critical sectors.
Table of Contents
Chapter 1 Methodology and Scope
- 1.1 Market scope and definition
- 1.2 Research design
- 1.2.1 Research approach
- 1.2.2 Data collection methods
- 1.3 Data mining sources
- 1.3.1 Global
- 1.3.2 Regional/Country
- 1.4 Base estimates and calculations
- 1.4.1 Base year calculation
- 1.4.2 Key trends for market estimation
- 1.5 Primary research and validation
- 1.5.1 Primary sources
- 1.6 Forecast model
- 1.7 Research assumptions and limitations
Chapter 2 Executive Summary
- 2.1 Industry 360° synopsis, 2022 - 2035
- 2.2 Key market trends
- 2.2.1 Product type trends
- 2.2.2 Output signal type trends
- 2.2.3 Spectral range trends
- 2.2.4 End-use Industry trends
- 2.2.5 Regional trends
- 2.3 TAM Analysis, 2026-2035
- 2.4 CXO perspectives: Strategic imperatives
- 2.4.1 Executive decision points
- 2.4.2 Critical success factors
- 2.5 Future outlook and strategic recommendations
Chapter 3 Industry Insights
- 3.1 Industry ecosystem analysis
- 3.1.1 Supplier Landscape
- 3.1.2 Profit Margin
- 3.1.3 Cost structure
- 3.1.4 Value addition at each stage
- 3.1.5 Factor affecting the value chain
- 3.1.6 Disruptions
- 3.2 Industry impact forces
- 3.2.1 Growth drivers
- 3.2.1.1 Rising ADAS and LiDAR integration in passenger vehicles
- 3.2.1.2 Expanding use in wearable health monitoring devices
- 3.2.1.3 Optical sensing adoption in medical diagnostics and imaging
- 3.2.1.4 Demand for precise environmental and gas monitoring systems
- 3.2.1.5 Growth of smart factories using photoelectric sensing
- 3.2.2 Industry pitfalls and challenges
- 3.2.2.1 High calibration and alignment costs for precision applications
- 3.2.2.2 Competition from low-cost MEMS and capacitive sensors
- 3.2.3 Market opportunities
- 3.2.3.1 Optical biosensors for non-invasive disease diagnostics
- 3.2.3.2 Industrial safety compliance driving machine-vision sensors
- 3.2.1 Growth drivers
- 3.3 Growth potential analysis
- 3.4 Regulatory landscape
- 3.4.1 North America
- 3.4.2 Europe
- 3.4.3 Asia Pacific
- 3.4.4 Latin America
- 3.4.5 Middle East & Africa
- 3.5 Porter’s analysis
- 3.6 PESTEL analysis
- 3.7 Technology and Innovation landscape
- 3.7.1 Current technological trends
- 3.7.2 Emerging technologies
- 3.8 Price trends
- 3.8.1 By region
- 3.8.2 By product
- 3.9 Pricing Strategies
- 3.10 Emerging Business Models
- 3.11 Compliance Requirements
Chapter 4 Competitive Landscape, 2025
- 4.1 Introduction
- 4.2 Company market share analysis
- 4.2.1 By region
- 4.2.1.1 North America
- 4.2.1.2 Europe
- 4.2.1.3 Asia Pacific
- 4.2.1.4 Latin America
- 4.2.1.5 Middle East & Africa
- 4.2.2 Market concentration analysis
- 4.2.1 By region
- 4.3 Competitive benchmarking of key players
- 4.3.1 Financial performance comparison
- 4.3.1.1 Revenue
- 4.3.1.2 Profit margin
- 4.3.1.3 R&D
- 4.3.2 Product portfolio comparison
- 4.3.2.1 Product range breadth
- 4.3.2.2 Technology
- 4.3.2.3 Innovation
- 4.3.3 Geographic presence comparison
- 4.3.3.1 Global footprint analysis
- 4.3.3.2 Service network coverage
- 4.3.3.3 Market penetration by region
- 4.3.4 Competitive positioning matrix
- 4.3.4.1 Leaders
- 4.3.4.2 Challengers
- 4.3.4.3 Followers
- 4.3.4.4 Niche players
- 4.3.5 Strategic outlook matrix
- 4.3.1 Financial performance comparison
- 4.4 Key developments
- 4.4.1 Mergers and acquisitions
- 4.4.2 Partnerships and collaborations
- 4.4.3 Technological advancements
- 4.4.4 Expansion and investment strategies
- 4.4.5 Digital transformation initiatives
- 4.5 Emerging/ startup competitors landscape
Chapter 5 Market Estimates and Forecast, By Product Type, 2022 - 2035 (USD Million)
- 5.1 Key trends
- 5.2 Discrete photodetectors
- 5.3 Photoelectric proximity sensors
- 5.4 Fiber optic sensors
- 5.5 Image sensors
- 5.6 Active ranging sensor modules
- 5.7 Others
Chapter 6 Market Estimates and Forecast, By Output Signal Type, 2022 - 2035 (USD Million)
- 6.1 Key trends
- 6.2 Analog output sensors
- 6.3 Digital output sensors
- 6.4 Hybrid & configurable output sensors
Chapter 7 Market Estimates and Forecast, By Spectral Range, 2022 - 2035 (USD Million)
- 7.1 Key trends
- 7.2 Ultraviolet (UV) sensors
- 7.3 Visible spectrum sensors
- 7.4 Infrared (IR) sensors
- 7.5 Broadband & multi-spectral sensors
Chapter 8 Market Estimates and Forecast, By End-use Industry, 2022 - 2035 (USD Million)
- 8.1 Key trends
- 8.2 Automotive
- 8.3 Industrial
- 8.4 Consumer Electronics
- 8.5 Telecommunications
- 8.6 Healthcare Systems
- 8.7 Aerospace & Defense
- 8.8 Others
Chapter 9 Market Estimates and Forecast, By Region, 2022 - 2035 (USD Million)
- 9.1 Key trends
- 9.2 North America
- 9.2.1 U.S.
- 9.2.2 Canada
- 9.3 Europe
- 9.3.1 Germany
- 9.3.2 UK
- 9.3.3 France
- 9.3.4 Spain
- 9.3.5 Italy
- 9.3.6 Russia
- 9.4 Asia Pacific
- 9.4.1 China
- 9.4.2 India
- 9.4.3 Japan
- 9.4.4 Australia
- 9.4.5 South Korea
- 9.5 Latin America
- 9.5.1 Brazil
- 9.5.2 Mexico
- 9.5.3 Argentina
- 9.6 Middle East and Africa
- 9.6.1 South Africa
- 9.6.2 Saudi Arabia
- 9.6.3 UAE
Chapter 10 Company Profiles
- 10.1 Global Key Players
- 10.1.1 ams-OSRAM AG
- 10.1.2 STMicroelectronics N.V.
- 10.1.3 Sony Group Corporation
- 10.1.4 Texas Instruments Incorporated
- 10.1.5 Honeywell International Inc.
- 10.1.6 Panasonic Corporation
- 10.2 Regional key players
- 10.2.1 North America
- 10.2.1.1 ON Semiconductor Corp.
- 10.2.1.2 Broadcom Inc.
- 10.2.1.3 Vishay Intertechnology, Inc.
- 10.2.1.4 TE Connectivity Ltd.
- 10.2.2 Asia Pacific
- 10.2.2.1 Hamamatsu Photonics K.K.
- 10.2.2.2 Keyence Corporation
- 10.2.2.3 ROHM Co., Ltd.
- 10.2.3 Europe
- 10.2.3.1 SICK AG
- 10.2.3.2 Jenoptik AG
- 10.2.1 North America
- 10.3 Niche Players/Disruptors
- 10.3.1 SiLC Technologies, Inc.
- 10.3.2 Rockley Photonics Holdings Ltd.

