
PUBLISHER: Global Market Insights Inc. | PRODUCT CODE: 1959620

PUBLISHER: Global Market Insights Inc. | PRODUCT CODE: 1959620
Particulate Matter Monitoring Market Opportunity, Growth Drivers, Industry Trend Analysis, and Forecast 2026 - 2035
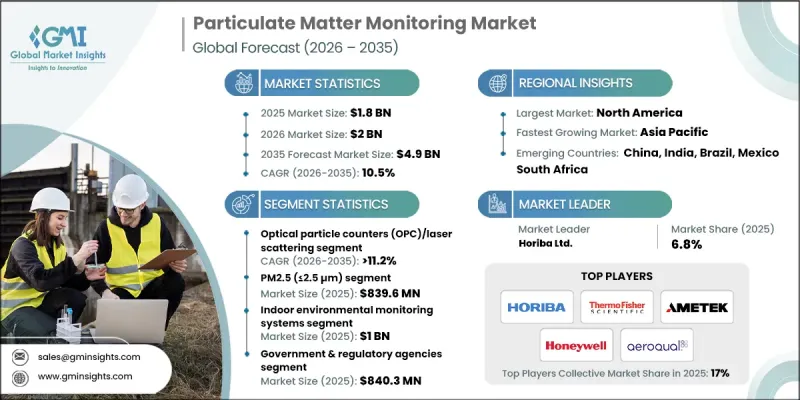
The Global Particulate Matter Monitoring Market was valued at USD 1.8 billion in 2025 and is estimated to grow at a CAGR of 10.5% to reach USD 4.9 billion by 2035.
The market focuses on detecting suspended solid particles and liquid droplets in the air, including dust, soot, and smoke, with particular attention to PM2.5 and PM10 levels to assess air quality. Advanced monitoring solutions, including high-precision reference stations, portable AI-enabled sensors with real-time connectivity, and IoT-based devices, are increasingly deployed in indoor and outdoor environments. These systems are critical for public health risk evaluation, regulatory compliance, and pollution management initiatives. Rising global urbanization, industrialization, and stricter air quality regulations are fueling demand for accurate PM monitoring. Governments and environmental agencies are investing heavily in monitoring infrastructure and analytics platforms to provide reliable data for policymaking, urban planning, and public health protection. The combination of technological advancements and regulatory pressure is driving faster adoption of PM monitoring systems worldwide.
| Market Scope | |
|---|---|
| Start Year | 2025 |
| Forecast Year | 2026-2035 |
| Start Value | $1.8 Billion |
| Forecast Value | $4.9 Billion |
| CAGR | 10.5% |
The optical particle counter (OPC)/laser scattering segment is projected to grow at 11.2% CAGR through 2035 and currently dominates the market. Its prominence stems from its high measurement accuracy, real-time monitoring capability, and ability to detect a wide range of particle sizes. These systems are extensively used to track ambient air quality, emissions, and ensure regulatory compliance. The ongoing advancement of laser scattering and OPC technology is creating new opportunities by enhancing sensor sensitivity, improving calibration stability, and enabling more comprehensive data analysis from fewer devices. Manufacturers are focusing on these improvements to meet the rising demand for precise and efficient monitoring solutions in industrial, urban, and indoor applications.
The PM2.5 (<=2.5 µm) segment accounted for USD 839.6 million in 2025 and holds the largest share of the particulate matter monitoring market. This dominance is driven by the strong link between PM2.5 exposure and health risks such as respiratory and cardiovascular diseases. Increasing awareness, public health initiatives, and the use of PM2.5 data in urban planning and pollution reduction programs are fueling demand for monitoring systems. Manufacturers are prioritizing the development of compact, low-maintenance PM2.5 devices, with integration into digital air quality networks to support regulatory compliance and broaden adoption across industrial, urban, and indoor environments.
U.S. Particulate Matter Monitoring Market reached USD 719.3 million in 2025. The region continues to lead the industry due to heightened focus on public health, urban air pollution mitigation, and smart city programs. Strong federal investments in air quality infrastructure, stringent environmental regulations, and the presence of major industry players contribute to North America's dominant market position. Manufacturers in the U.S. are emphasizing scalable, accurate, and actionable PM monitoring solutions, leveraging technological innovations, partnerships with governmental organizations, and cloud-based analytics to improve monitoring efficiency and system interoperability.
Key players operating in the Global Particulate Matter Monitoring Market include Enviro Technology Services plc, ACOEM Group, Met One Instruments, Inc., 3M Company, GrayWolf Sensing Solutions, Thermo Fisher Scientific, Inc., Aeroqual Group Limited, Siemens AG, Beckman Coulter, Inc., Rupprecht & Patashnick Co., Inc. (R&P), Palas GmbH, TSI Incorporated, Opsis AB, Kanomax USA, Inc., PCE Instruments, Horiba Ltd., AMETEK, Inc., Honeywell International Inc., Ecotech Pty Ltd, and Terra. Companies in the particulate matter monitoring market are pursuing several strategies to strengthen their market presence. They are investing heavily in R&D to enhance sensor sensitivity, reduce maintenance requirements, and integrate AI and IoT capabilities. Strategic partnerships with governments, municipalities, and environmental agencies help secure long-term contracts and support infrastructure expansion. Firms are also focusing on product diversification, offering solutions for urban, industrial, and indoor monitoring.
Table of Contents
Chapter 1 Methodology and Scope
- 1.1 Market scope and definition
- 1.2 Research design
- 1.2.1 Research approach
- 1.2.2 Data collection methods
- 1.3 Data mining sources
- 1.3.1 Global
- 1.3.2 Regional/Country
- 1.4 Base estimates and calculations
- 1.4.1 Base year calculation
- 1.4.2 Key trends for market estimation
- 1.5 Primary research and validation
- 1.5.1 Primary sources
- 1.6 Forecast model
- 1.7 Research assumptions and limitations
Chapter 2 Executive Summary
- 2.1 Industry snapshot
- 2.2 Key market trends
- 2.2.1 Monitoring Technology trends
- 2.2.2 Particulate Matter Size trends
- 2.2.3 Product Type trends
- 2.2.4 Application trends
- 2.2.5 End-User Industry trends
- 2.2.6 Regional trends
- 2.3 TAM Analysis, 2026-2035 (USD Billion)
- 2.4 CXO perspectives: Strategic imperatives
- 2.4.1 Executive decision points
- 2.4.2 critical success factors
- 2.5 Future outlook and strategic recommendations
Chapter 3 Industry Insights
- 3.1 Industry ecosystem analysis
- 3.1.1 Supplier Landscape
- 3.1.2 Profit Margin
- 3.1.3 Cost structure
- 3.1.4 Value addition at each stage
- 3.1.5 Factor affecting the value chain
- 3.1.6 Disruptions
- 3.2 Industry impact forces
- 3.2.1 Growth drivers
- 3.2.1.1 Increasing government laws and standards for monitoring air quality
- 3.2.1.2 Monitoring of ambient air quality is becoming more important
- 3.2.1.3 Rising demand of particulate matter levels in automotive and transportation sectors
- 3.2.1.4 Increasing awareness about the health risks associated of particulate matter
- 3.2.1.5 Ongoing advancements in PM monitoring systems
- 3.2.2 Industry pitfalls and challenges
- 3.2.2.1 Installing and maintaining PM monitoring devices can be difficult
- 3.2.2.2 Delays in underdeveloped nations in implementing PM monitoring solutions
- 3.2.3 Market opportunities
- 3.2.3.1 Expansion of smart cities and digital environmental infrastructure
- 3.2.3.2 Growing demand for indoor air quality monitoring
- 3.2.1 Growth drivers
- 3.3 Growth potential analysis
- 3.4 Regulatory landscape
- 3.4.1 North America
- 3.4.2 Europe
- 3.4.3 Asia Pacific
- 3.4.4 Latin America
- 3.4.5 Middle East & Africa
- 3.5 Porter’s analysis
- 3.6 PESTEL analysis
- 3.7 Technology and innovation landscape
- 3.7.1 Current technological trends
- 3.7.2 Emerging technologies
- 3.8 Price trends
- 3.8.1 Historical price analysis (2022-2024)
- 3.8.2 Price trend drivers
- 3.8.3 Regional price variations
- 3.8.4 Price forecast (2026-2035)
- 3.9 Pricing strategies
- 3.10 Emerging business models
- 3.11 Compliance requirements
Chapter 4 Competitive Landscape, 2025
- 4.1 Introduction
- 4.2 Company market share analysis
- 4.2.1 By Region
- 4.2.1.1 North America
- 4.2.1.2 Europe
- 4.2.1.3 Asia Pacific
- 4.2.1.4 Latin America
- 4.2.1.5 Middle East & Africa
- 4.2.2 Market Concentration Analysis
- 4.2.1 By Region
- 4.3 Competitive benchmarking of key players
- 4.3.1 Financial performance comparison
- 4.3.1.1 Revenue
- 4.3.1.2 Profit margin
- 4.3.1.3 R&D
- 4.3.2 Product portfolio comparison
- 4.3.2.1 Product range breadth
- 4.3.2.2 Technology
- 4.3.2.3 Innovation
- 4.3.3 Geographic presence comparison
- 4.3.3.1 Global footprint analysis
- 4.3.3.2 Service network coverage
- 4.3.3.3 Market penetration by region
- 4.3.4 Competitive positioning matrix
- 4.3.4.1 Leaders
- 4.3.4.2 Challengers
- 4.3.4.3 Followers
- 4.3.4.4 Niche players
- 4.3.5 Strategic outlook matrix
- 4.3.1 Financial performance comparison
- 4.4 Key developments, 2022-2025
- 4.4.1 Mergers and acquisitions
- 4.4.2 Partnerships and collaborations
- 4.4.3 Technological advancements
- 4.4.4 Expansion and investment strategies
- 4.4.5 Sustainability initiatives
- 4.4.6 Digital transformation initiatives
- 4.5 Emerging/ startup competitors landscape
Chapter 5 Particulate Matter Monitoring Market Estimates & Forecast, By Monitoring Technology, 2022 - 2035 (USD Billion)
- 5.1 Key trends,
- 5.2 Hardware
- 5.3 Gravimetric Methods
- 5.4 Beta Attenuation Monitors (BAM)
- 5.5 Tapered Element Oscillating Microbalance (TEOM)
- 5.6 Optical Particle Counters (OPC)/Laser Scattering
- 5.6.1 Professional/Reference-Grade OPC
- 5.6.2 Low-Cost Optical Sensors
- 5.6.3 Nephelometer
Chapter 6 Market Estimates and Forecast, By Particulate Matter Size, 2022 - 2035 (USD Billion)
- 6.1 Key trends
- 6.2 PM2.5 (≤ 2.5 µm)
- 6.3 PM10 (≤10 µm)
- 6.4 PM1 (≤ 1 µm)
Chapter 7 Market Estimates and Forecast, By Product Type Size, 2022 - 2035 (USD Billion)
- 7.1 Key trends
- 7.2 Outdoor Ambient Monitoring Systems
- 7.2.1 Fixed Ambient Monitoring Stations
- 7.2.2 Portable/Mobile Outdoor Monitors
- 7.2.3 Fence-line/Perimeter Monitors
- 7.2.4 Mobile Platform-Mounted Sensors
- 7.3 Indoor Environmental Monitoring Systems
- 7.3.1 General Building IAQ Monitors
- 7.3.2 Cleanroom & Controlled Environment Particle Counters
- 7.3.3 Industrial Indoor Monitors
- 7.3.4 HVAC-Integrated Monitoring Systems
- 7.3.5 Personal Wearable Exposure Monitors
Chapter 8 Market Estimates and Forecast, By Application, 2022 - 2035 (USD Billion)
- 8.1 Key trends
- 8.2 Regulatory Compliance & Ambient Air Quality Monitoring
- 8.3 Occupational Health & Workplace Safety
- 8.4 Industrial Process & Emission Monitoring
- 8.5 Building & Facility Indoor Air Quality Management
- 8.6 Personal Exposure Assessment & Epidemiological Research
- 8.7 Others
Chapter 9 Market Estimates and Forecast, By End-User Industry, 2022 - 2035 (USD Billion)
- 9.1 Key trends
- 9.2 Government & Regulatory Agencies
- 9.3 Power Generation
- 9.4 Chemical & Petrochemical Manufacturing
- 9.5 Metals & Mining
- 9.6 Healthcare & Life Sciences
- 9.7 Semiconductor & Electronics Manufacturing
- 9.8 Agriculture & Food Processing
- 9.9 Others
Chapter 10 Particulate Matter Monitoring Market Estimates & Forecast, By Region, 2022 - 2035 (USD Billion)
- 10.1 Key trends, by region
- 10.2 North America
- 10.2.1 U.S.
- 10.2.2 Canada
- 10.3 Europe
- 10.3.1 UK
- 10.3.2 Germany
- 10.3.3 France
- 10.3.4 Italy
- 10.3.5 Spain
- 10.3.6 Netherlands
- 10.3.7 Rest of Europe
- 10.4 Asia-Pacific
- 10.4.1 China
- 10.4.2 India
- 10.4.3 Japan
- 10.4.4 South Korea
- 10.4.5 Australia
- 10.4.6 Rest of Asia-Pacific
- 10.5 Latin America
- 10.5.1 Brazil
- 10.5.2 Mexico
- 10.5.3 Argentina
- 10.5.4 Rest of Latin America
- 10.6 MEA
- 10.6.1 Saudi Arabia
- 10.6.2 South Africa
- 10.6.3 UAE
- 10.6.4 Rest of MEA
Chapter 11 Company Profiles
- 11.1 3M Company
- 11.2 ACOEM Group
- 11.3 Aeroqual Group Limited
- 11.4 AMETEK, Inc.
- 11.5 Beckman Coulter, Inc.
- 11.6 Ecotech Pty Ltd
- 11.7 Enviro Technology Services plc
- 11.8 GrayWolf Sensing Solutions
- 11.9 Honeywell International Inc.
- 11.10 Horiba Ltd.
- 11.11 Kanomax USA, Inc.
- 11.12 Met One Instruments, Inc.
- 11.13 Opsis AB
- 11.14 Palas GmbH
- 11.15 PCE Instruments
- 11.16 Rupprecht & Patashnick Co., Inc. (R&P)
- 11.17 Siemens AG
- 11.18 terra
- 11.19 Thermo Fisher Scientific, Inc.
- 11.20 TSI Incorporated

