
PUBLISHER: Global Market Insights Inc. | PRODUCT CODE: 1982279

PUBLISHER: Global Market Insights Inc. | PRODUCT CODE: 1982279
Variable Rate Technology (VRT) Equipment Market Opportunity, Growth Drivers, Industry Trend Analysis, and Forecast 2026 - 2035
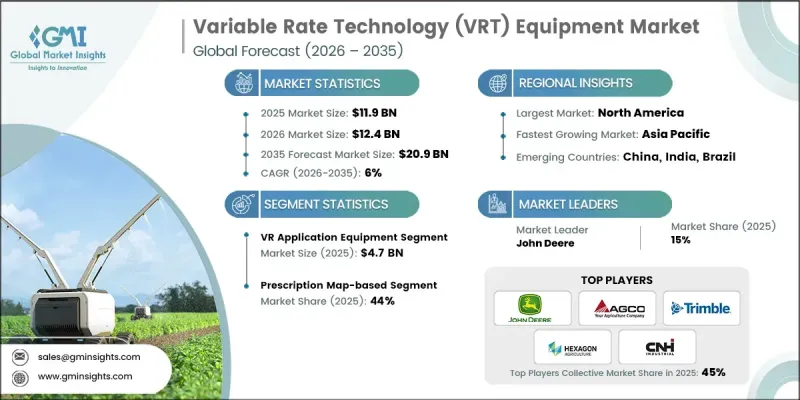
The Global Variable Rate Technology (VRT) Equipment Market was valued at USD 11.9 billion in 2025 and is estimated to grow at a CAGR of 6% to reach USD 20.9 billion by 2035.
Market growth is tied to the understanding that agricultural fields are not uniform and require tailored input management. Farmers are steadily transitioning from fixed-rate application practices to more adaptive systems that respond to real-time field variability. Variable rate technology (VRT) equipment enables operators to fine-tune input levels according to soil conditions, crop requirements, and productivity zones. This data-driven approach improves operational precision and enhances resource efficiency while supporting more sustainable farm management. As growers seek greater visibility and control over production decisions, VRT solutions are becoming integral to modern precision agriculture strategies. The market reflects a broader shift toward intelligent farming systems that balance productivity, cost optimization, and environmental stewardship, positioning VRT equipment as a critical component in the evolution of advanced agricultural operations worldwide.
| Market Scope | |
|---|---|
| Start Year | 2025 |
| Forecast Year | 2026-2035 |
| Start Value | $11.9 Billion |
| Forecast Value | $20.9 Billion |
| CAGR | 6% |
From a commercial perspective, the variable rate technology equipment market emphasizes practicality, reliability, and seamless integration. Manufacturers focus on developing systems that are compatible with existing agricultural machinery, allowing farmers to implement upgrades without disrupting routine fieldwork. User-friendly interfaces, intuitive controls, and consistent performance remain central to purchasing decisions. Distribution partners and service providers contribute significantly by delivering technical guidance, training, and post-sale support. This collaborative ecosystem fosters long-term engagement between equipment suppliers and farming operations, transforming transactions into sustained partnerships built on operational trust and measurable results.
In 2025, the variable rate application equipment segment generated USD 4.7 billion, representing the largest share of the variable rate technology equipment market. Variable Rate Application (VRA) systems lead the market because they provide immediate and quantifiable financial advantages. By enabling site-specific application of critical agricultural inputs based on field data and digital recommendations, VRA equipment helps reduce excess usage while protecting or enhancing yield performance. Since input costs represent a substantial portion of overall farm expenditure, technologies that directly optimize these expenses deliver a strong return on investment and drive widespread adoption across precision agriculture platforms.
The prescription map-based segment accounted for 44% share in 2025. Prescription-based systems are widely adopted because they deliver consistent agronomic precision and predictable results. These technologies rely on pre-developed digital field maps generated through agronomic data analysis to determine optimal application rates across different management zones. By applying data-informed strategies in advance of field operations, farmers gain greater control over input distribution and crop performance, reinforcing the value of structured planning within precision farming frameworks.
United States Variable Rate Technology (VRT) Equipment Market held 80% share in 2025, generating around USD 3.9 billion in revenue. The region represents the most established market for VRT equipment, supported by early adoption of precision agriculture practices and the presence of large-scale commercial farming enterprises. High utilization of GPS-enabled machinery, advanced farm management platforms, and strong original equipment manufacturer ecosystems enables seamless integration of VRT systems. This mature infrastructure accelerates deployment and strengthens the region's leadership position in the global market.
Key companies operating in the Global Variable Rate Technology (VRT) Equipment Market include John Deere (Deere & Company), Trimble Inc., AGCO Corporation, CNH Industrial, Hexagon Agriculture, Topcon Positioning Systems, Claas, Kverneland Group, AMAZONE, Rauch, Lindsay Corporation, Precision Planting, Muller Elektronik, Yara International, and Raven Industries. Companies in the Global Variable Rate Technology (VRT) Equipment Market are enhancing their competitive standing through continuous innovation, strategic alliances, and digital ecosystem expansion. Leading players invest heavily in research and development to improve software analytics, automation capabilities, and machine compatibility. Many manufacturers form partnerships with agronomy service providers and technology firms to deliver integrated precision farming solutions. Expanding product portfolios, strengthening dealer networks, and offering data-driven advisory services are also central strategies.
Table of Contents
Chapter 1 Methodology and Scope
- 1.1 Market scope and definition
- 1.2 Research design
- 1.2.1 Research approach
- 1.2.2 Data collection methods
- 1.3 Data mining sources
- 1.3.1 Global
- 1.3.2 Regional/Country
- 1.4 Base estimates and calculations
- 1.4.1 Base year calculation
- 1.4.2 Key trends for market estimation
- 1.5 Primary research and validation
- 1.5.1 Primary sources
- 1.6 Forecast model
- 1.7 Research assumptions and limitations
Chapter 2 Executive Summary
- 2.1 Industry 360° synopsis
- 2.2 Key market trends
- 2.2.1 regional
- 2.2.2 equipment type
- 2.2.3 farm size
- 2.2.4 end use
- 2.2.5 application
- 2.2.6 distribution channel
Chapter 3 Industry Insights
- 3.1 Industry ecosystem analysis
- 3.1.1 Supplier landscape
- 3.1.2 Profit margin
- 3.1.3 Value addition at each stage
- 3.1.4 Factor affecting the value chain
- 3.2 Industry impact forces
- 3.2.1 Growth drivers
- 3.2.1.1 Accelerated adoption of precision agriculture practices
- 3.2.1.2 Rising need for input cost optimization and resource efficiency
- 3.2.1.3 Supportive government policies and digital farming incentives
- 3.2.2 Industry pitfalls & challenges
- 3.2.2.1 High initial investment and integration costs
- 3.2.2.2 Technical complexity and skill gaps among end users
- 3.2.3 Opportunities
- 3.2.3.1 Expansion in emerging and large-scale agricultural economies
- 3.2.3.2 Integration with ai, iot, and advanced farm management platforms
- 3.2.1 Growth drivers
- 3.3 Growth potential analysis
- 3.4 Major market trends and Disruptions
- 3.5 Future market trends
- 3.6 Risk and mitigation Analysis
- 3.7 Technology and innovation landscape
- 3.7.1 Current technological trends
- 3.7.2 Emerging technologies
- 3.8 Price trends
- 3.8.1 By region
- 3.8.2 by equipment type
- 3.9 Regulatory landscape
- 3.9.1 Standards and compliance requirement
- 3.9.2 Certification standards
- 3.10 Porter's analysis
- 3.11 PESTEL analysis
Chapter 4 Competitive Landscape, 2025
- 4.1 Introduction
- 4.2 Company market share analysis
- 4.2.1 By region
- 4.2.1.1 North America
- 4.2.1.2 Europe
- 4.2.1.3 Asia Pacific
- 4.2.1.4 Latin America
- 4.2.1.5 Middle East and Africa
- 4.2.1 By region
- 4.3 Company matrix analysis
- 4.4 Competitive analysis of major market players
- 4.5 Competitive positioning matrix
- 4.6 Key developments
- 4.6.1 Mergers & acquisitions
- 4.6.2 Partnerships & collaborations
- 4.6.3 New product launches
- 4.6.4 Expansion plans
Chapter 5 Market Estimates & Forecast, By Equipment Type, 2022-2035 (USD Billion) (Tons)
- 5.1 Key trends
- 5.1.1 GPS/GNSS guidance and positioning systems
- 5.1.2 Variable rate controllers and consoles
- 5.1.3 Sensors and monitoring systems
- 5.1.4 Variable rate application equipment
- 5.1.5 Software and decision support systems
Chapter 6 Market Estimates & Forecast, By Technology Type, 2022-2035 (USD Billion) (Tons)
- 6.1 Key trends
- 6.2 Prescription map-based VRT
- 6.3 Real-time sensor-based VRT
- 6.4 Integrated systems
Chapter 7 Market Estimates & Forecast, By System Configuration, 2022-2035 (USD Billion) (Tons)
- 7.1 Key trends
- 7.2 Small family farms (<600 acres)
- 7.3 Midsize family farms (600-1,700 acres)
- 7.4 Large-scale family farms (>1,700 acres)
Chapter 8 Market Estimates & Forecast, By End Use, 2022-2035 (USD Billion) (Tons)
- 8.1 Key trends
- 8.2 Row crops (broadacre agriculture)
- 8.3 Specialty crops (high-value perennials)
- 8.4 Forage and pasture
- 8.5 Precision livestock farming
Chapter 9 Market Estimates & Forecast, By Application, 2022-2035 (USD Billion) (Tons)
- 9.1 Key trends
- 9.2 Variable rate nutrient / fertilizer application (VRNT)
- 9.3 Variable rate seeding / planting
- 9.4 Variable rate pesticide / herbicide application
- 9.5 Variable rate irrigation (VRI)
Chapter 10 Market Estimates & Forecast, By Distribution Channel, 2022-2035 (USD Billion) (Tons)
- 10.1 Key trends
- 10.2 Direct sales
- 10.3 Indirect sales
Chapter 11 Market Estimates and Forecast, By Region, 2022 - 2035 (USD Billion) (Tons)
- 11.1 Key trends
- 11.2 North America
- 11.2.1 U.S.
- 11.2.2 Canada
- 11.3 Europe
- 11.3.1 Germany
- 11.3.2 UK
- 11.3.3 France
- 11.3.4 Italy
- 11.3.5 Spain
- 11.4 Asia Pacific
- 11.4.1 China
- 11.4.2 Japan
- 11.4.3 India
- 11.4.4 South Korea
- 11.4.5 Australia
- 11.4.6 Malaysia
- 11.4.7 Indonesia
- 11.5 Latin America
- 11.5.1 Brazil
- 11.5.2 Mexico
- 11.6 Middle East and Africa
- 11.6.1 South Africa
- 11.6.2 Saudi Arabia
- 11.6.3 UAE
Chapter 12 Company Profiles
- 12.1 John Deere (Deere & Company)
- 12.2 Trimble Inc.
- 12.3 CNH Industrial
- 12.4 AGCO Corporation
- 12.5 Hexagon Agriculture
- 12.6 Topcon Positioning Systems
- 12.7 AMAZONE
- 12.8 Kverneland Group
- 12.9 Rauch
- 12.10 Claas
- 12.11 Lindsay Corporation
- 12.12 Precision Planting
- 12.13 Muller-Elektronik
- 12.14 Yara International
- 12.15 Raven Industries

