
PUBLISHER: Global Market Insights Inc. | PRODUCT CODE: 1982384

PUBLISHER: Global Market Insights Inc. | PRODUCT CODE: 1982384
Profilometer Market Opportunity, Growth Drivers, Industry Trend Analysis, and Forecast 2026 - 2035
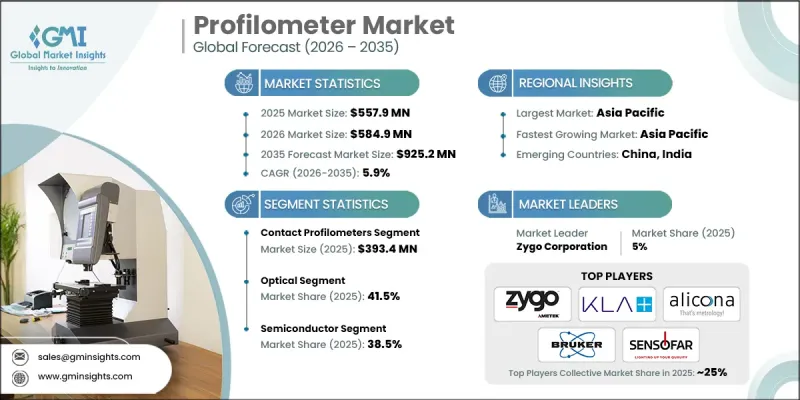
The Global Profilometer Market was valued at USD 557.9 million in 2025 and is estimated to grow at a CAGR of 5.9% to reach USD 925.2 million by 2035.
Profilometers are essential instruments for industries requiring precise surface measurements, including semiconductor fabrication, aerospace, automotive, and medical device manufacturing. These devices assess surface characteristics such as roughness, texture, and shape to ensure that products meet stringent quality standards. As manufacturing processes become more sophisticated, the demand for profilometers capable of providing highly detailed measurements continues to rise. Aerospace and medical device sectors rely heavily on these tools for maintaining component performance, regulatory compliance, and structural integrity. The market is also witnessing a shift from traditional stylus-based contact systems toward advanced optical profilometers, which provide faster, non-destructive measurements and can analyze complex geometries with high accuracy. This evolution is driven by the growing need for high-resolution, non-contact measurement solutions in precision-focused industries.
| Market Scope | |
|---|---|
| Start Year | 2025 |
| Forecast Year | 2026-2035 |
| Start Value | $557.9 Million |
| Forecast Value | $925.2 Million |
| CAGR | 5.9% |
The contact profilometers segment generated USD 393.4 million in 2025 and is expected to grow at a CAGR of 6% from 2026 to 2035. Contact profilometers remain widely used because of their reliability, cost-effectiveness, and precise surface roughness measurement capabilities. Their stylus-based mechanism performs consistently in industrial settings where tactile assessment is preferred. Industries such as automotive, heavy manufacturing, and metalworking continue to adopt contact systems for routine surface characterization and compliance with standard roughness parameters like Ra, Rz, and Rq.
The optical profilometers segment held a 41.5% share in 2025 and is anticipated to grow at a CAGR of 6.3% through 2035. Optical systems, including laser scanning, interferometry, and confocal solutions, are increasingly popular due to their high-speed, high-resolution, and non-destructive capabilities. These devices can capture 3D surface topography rapidly without physical contact, making them ideal for delicate, miniaturized, or complex components. Demand for optical profilometers is accelerating with the expansion of semiconductor, medical, and advanced electronics manufacturing, where precise micro- and nano-scale inspections are critical.
U.S. Profilometer Market reached USD 131.6 million in 2025 and is projected to grow at a CAGR of 6.2% through 2035. Strong demand from semiconductor manufacturing, aerospace, biomedical devices, and advanced automotive engineering drives market growth. The nation's advanced R&D capabilities, investments in nanotechnology, and Industry 4.0 adoption support the widespread integration of high-end optical and non-contact profilometers. Semiconductor expansion initiatives and reshoring strategies further fuel demand for precise surface metrology solutions.
Key players in the Global Profilometer Market include AMETEK, Inc., Bruker, Carl Zeiss, Evident Scientific, Jenoptik Group, Keyence Corporation, KLA Corporation, L.S. Starrett Company, Mahr Inc., Mitutoyo America Corporation, Nikon Instruments, Sensofar, Solarius, Inc., Tokyo Seimitsu Co., Ltd., and Zygo Corporation. Companies in the Global Profilometer Market are reinforcing their position by focusing on technological innovation, expanding optical and non-contact product lines, and entering new industrial segments. They invest in R&D to enhance measurement accuracy, speed, and automation capabilities while ensuring compatibility with Industry 4.0 systems. Strategic collaborations with semiconductor, aerospace, and medical device manufacturers enable co-development of tailored solutions. Companies leverage digital marketing, trade shows, and specialized training programs to boost brand visibility and technical credibility. Expanding service networks and offering calibration, maintenance, and support services further strengthen customer loyalty. Additionally, players are exploring emerging markets, improving product affordability, and highlighting sustainable and efficient solutions to differentiate their offerings and capture greater market share.
Table of Contents
Chapter 1 Methodology & Scope
- 1.1 Market scope & definitions
- 1.2 Research design
- 1.2.1 Research approach
- 1.2.2 Data collection methods
- 1.3 Base estimates and calculations
- 1.3.1 Base year calculation
- 1.3.2 Market estimates & forecasts parameters
- 1.4 Forecast Model
- 1.4.1 Key trends for market estimates
- 1.4.2 Quantified market impact analysis
- 1.4.2.1 Mathematical impact of growth parameters on forecast
- 1.4.3 Scenario analysis framework
- 1.5 Primary research and validation
- 1.5.1 Some of the primary sources (but not limited to)
- 1.6 Data mining sources
- 1.6.1 Paid Sources
- 1.7 Primary research and validation
- 1.7.1 Primary sources
- 1.8 Research Trail & confidence scoring
- 1.8.1 Research trail components
- 1.8.2 Scoring components
- 1.9 Research transparency addendum
- 1.9.1 Source attribution framework
- 1.9.2 Quality assurance metrics
- 1.9.3 Our commitment to trust
- 1.10 Market Definitions
Chapter 2 Executive Summary
- 2.1 Industry 360° synopsis
- 2.2 Key market trends
- 2.2.1 Regional
- 2.2.2 Product type
- 2.2.3 Type
- 2.2.4 Technology
- 2.2.5 End Use
- 2.2.6 Distribution channel
- 2.3 CXO perspectives: Strategic imperatives
- 2.3.1 Key decision points for industry executives
- 2.3.2 Critical success factors for market players
- 2.4 Future outlook and strategic recommendations
Chapter 3 Industry Insights
- 3.1 Industry ecosystem analysis
- 3.1.1 Supplier landscape
- 3.1.2 Profit margin
- 3.1.3 Value addition at each stage
- 3.1.4 Factor affecting the value chain
- 3.2 Industry impact forces
- 3.2.1 Growth drivers
- 3.2.1.1 Rising demand for high-precision surface measurement
- 3.2.1.2 Expansion of semiconductor & electronics manufacturing
- 3.2.1.3 Advancements in non-contact & 3d optical technologies
- 3.2.2 Pitfalls & Challenges
- 3.2.2.1 High equipment cost & integration complexity
- 3.2.2.2 Operational limitations across varied materials
- 3.2.3 Opportunities
- 3.2.3.1 Growing adoption in renewable energy & battery manufacturing
- 3.2.3.2 Integration with automation, robotics & inline metrology
- 3.2.1 Growth drivers
- 3.3 Growth potential analysis
- 3.4 Future market trends
- 3.5 Technology and innovation landscape
- 3.5.1 Current technological trends
- 3.5.2 Emerging technologies
- 3.6 Price trends
- 3.6.1 By region
- 3.6.2 By product
- 3.7 Regulatory landscape
- 3.7.1 North America
- 3.7.1.1 US: Consumer Product Safety Commission (CPSC) 16 Code of Federal Regulations (CFR) part 1512
- 3.7.1.2 Canada: International Organization for Standardization (ISO) 4210
- 3.7.2 Europe
- 3.7.2.1 Germany: Deutsches Institut fur Normung (DIN) European Norm (EN) ISO 4210
- 3.7.2.2 UK: European Norm (EN) ISO 4210 / United Kingdom Conformity Assessed (UKCA)
- 3.7.2.3 France: European Norm (EN) ISO 4210
- 3.7.3 Asia Pacific
- 3.7.3.1 China: Guobiao (GB) 3565
- 3.7.3.2 India: Indian Standard (IS) 10613
- 3.7.3.3 Japan: Japanese Industrial Standard (JIS) D 9110
- 3.7.4 Latin America
- 3.7.4.1 Brazil: Associacao Brasileira de Normas Tecnicas (ABNT) Norma Brasileira (NBR) ISO 4210
- 3.7.4.2 Mexico: International Organization for Standardization (ISO) 4210
- 3.7.5 Middle East & Africa
- 3.7.5.1 South Africa: South African National Standard (SANS) 311
- 3.7.5.2 Saudi Arabia: Saudi Standards, Metrology and Quality Organization (SASO) Gulf Standardization Organization (GSO) ISO 4210
- 3.7.1 North America
- 3.8 Trade data analysis
- 3.8.1 Import/export volume & value trends
- 3.8.2 Key trade corridors & tariff impact
- 3.9 Impact of AI & generative AI on the market
- 3.9.1 AI-driven disruption of existing business models
- 3.9.2 GenAI use cases & adoption roadmap by segment
- 3.9.3 Risks, limitations & regulatory considerations
- 3.10 Porter’s analysis
- 3.11 PESTEL analysis
Chapter 4 Competitive Landscape, 2025
- 4.1 Introduction
- 4.2 Company market share analysis
- 4.2.1 By Region
- 4.2.1.1 North America
- 4.2.1.2 Europe
- 4.2.1.3 Asia Pacific
- 4.2.1.4 Latin America
- 4.2.1.5 Middle East & Africa
- 4.2.1 By Region
- 4.3 Company matrix analysis
- 4.4 Competitive analysis of major market players
- 4.5 Competitive positioning matrix
- 4.6 Key developments
- 4.6.1 Mergers & acquisitions
- 4.6.2 Partnerships & collaborations
- 4.6.3 New product launches
- 4.6.4 Expansion plans
Chapter 5 Market Estimates & Forecast, By Product Type, 2022 - 2035, (USD Million) (Thousand Units)
- 5.1 Key trends
- 5.2 Contact profilometers
- 5.3 Non-contact profilometers
Chapter 6 Market Estimates & Forecast, By Type, 2022 - 2035, (USD Million) (Thousand Units)
- 6.1 Key trends
- 6.2 2D Profilometers
- 6.3 3D Profilometers
Chapter 7 Market Estimates & Forecast, By Technology, 2022 - 2035, (USD Million) (Thousand Units)
- 7.1 Key trends
- 7.2 Optical
- 7.3 Stylus
- 7.4 Laser scan
- 7.5 Interferometry
Chapter 8 Market Estimates & Forecast, By End Use, 2022 - 2035, (USD Million) (Thousand Units)
- 8.1 Key trends
- 8.2 Automotive
- 8.3 Semiconductor
- 8.4 Medical/healthcare
- 8.5 Aerospace
- 8.6 Electronics
- 8.7 Manufacturing
Chapter 9 Market Estimates & Forecast, By Distribution Channel, 2022 - 2035, (USD Million) (Thousand Units)
- 9.1 Key trends
- 9.2 Direct
- 9.3 Indirect
Chapter 10 Market Estimates & Forecast, By Region, 2022 - 2035, (USD Million) (Thousand Units)
- 10.1 Key trends
- 10.2 North America
- 10.2.1 U.S.
- 10.2.2 Canada
- 10.3 Europe
- 10.3.1 Germany
- 10.3.2 UK
- 10.3.3 France
- 10.3.4 Italy
- 10.3.5 Spain
- 10.4 Asia Pacific
- 10.4.1 China
- 10.4.2 India
- 10.4.3 Japan
- 10.4.4 South Korea
- 10.4.5 Australia
- 10.5 Latin America
- 10.5.1 Brazil
- 10.5.2 Mexico
- 10.5.3 Argentina
- 10.6 MEA
- 10.6.1 Saudi Arabia
- 10.6.2 UAE
- 10.6.3 South Africa
Chapter 11 Company Profiles
- 11.1 AMETEK, Inc.
- 11.2 Bruker
- 11.3 Carl Zeiss
- 11.4 Evident Scientific
- 11.5 Jenoptik Group
- 11.6 Keyence Corporation
- 11.7 KLA Corporation
- 11.8 L.S. Starrett Company
- 11.9 Mahr Inc.
- 11.10 Mitutoyo America Corporation
- 11.11 Nikon Instruments
- 11.12 Sensofar
- 11.13 Solarius, Inc.
- 11.14 TOKYO SEIMITSU Co., Ltd.
- 11.15 Zygo Corporation

