
PUBLISHER: Global Market Insights Inc. | PRODUCT CODE: 1998777

PUBLISHER: Global Market Insights Inc. | PRODUCT CODE: 1998777
Portable Projector Market Opportunity, Growth Drivers, Industry Trend Analysis, and Forecast 2026 - 2035
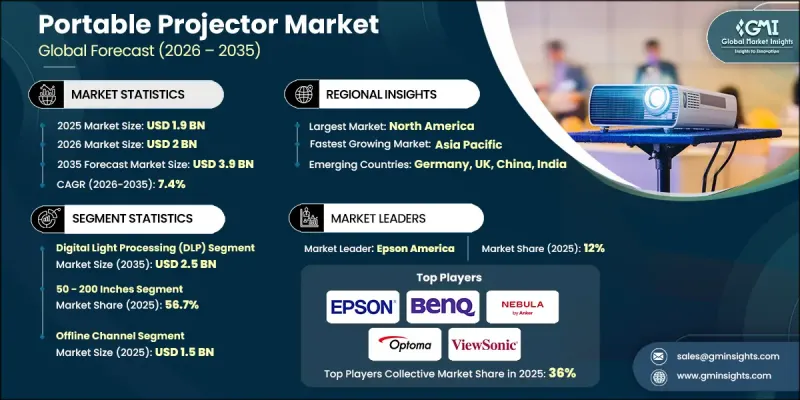
The Global Portable Projector Market was valued at USD 1.9 billion in 2025 and is estimated to grow at a CAGR of 7.4% to reach USD 3.9 billion by 2035.
The global portable projector industry is witnessing steady growth as digital learning and flexible presentation technologies become more widely adopted across multiple sectors. Educational institutions are increasingly integrating portable display solutions into classrooms to support interactive and collaborative learning environments. The growing emphasis on digital education tools is encouraging schools, universities, and training institutions to adopt compact projection devices that can be easily transported and deployed in different teaching spaces. Public initiatives supporting digital transformation in education are also contributing to the rising demand for portable projectors. Beyond the education sector, businesses and organizations are incorporating portable projection devices into professional training programs, workshops, and corporate learning sessions. These devices allow presenters to deliver visual content efficiently in a variety of environments without requiring permanent installations. Technological improvements in projection systems are further supporting market expansion, particularly as consumers seek higher resolution displays and enhanced visual clarity. Demand for advanced imaging technologies capable of delivering sharper images and improved color accuracy is increasing as users prioritize high-quality viewing experiences. As portable entertainment systems and flexible work environments become more common, portable projectors are expected to remain an important tool for both professional and personal use across the global portable projector market.
| Market Scope | |
|---|---|
| Start Year | 2025 |
| Forecast Year | 2026-2035 |
| Start Value | $1.9 Billion |
| Forecast Value | $3.9 Billion |
| CAGR | 7.4% |
The digital light processing (DLP) segment generated USD 1.2 billion in 2025 and is expected to reach USD 2.5 billion by 2035. DLP technology continues to represent a significant portion of the portable projector market due to its strong performance capabilities and compact design. Projectors based on this technology are widely recognized for delivering high contrast ratios and fast image response times, which contribute to clearer visual output. Their compact structure and lightweight construction make them particularly attractive for users who require highly portable devices that can be transported easily between locations. These advantages have strengthened the adoption of DLP projectors across professional and personal use cases. The technology also supports high-quality image rendering, which appeals to consumers seeking reliable visual performance for presentations and entertainment applications.
The 50-200 inches segment held 56.7% share in 2025. Mid-range projection sizes remain highly popular among consumers because they offer a practical balance between display size and device portability. These projectors provide sufficient screen dimensions for immersive viewing experiences while still maintaining compact form factors that allow convenient transport and setup. Their flexibility allows them to be used across a variety of settings, making them appealing to both residential and professional users. Many consumers are adopting projectors within this size range as part of their personal entertainment setups, contributing to increased product demand. The versatility of mid-size projection systems also supports their use in different environments where adaptable display solutions are required.
United States Portable Projector Market accounted for 82.5% share in 2025. The US portable projector industry benefits from a strong technology adoption culture and ongoing investment in digital infrastructure. Nationwide efforts to modernize learning environments and incorporate advanced educational technologies are encouraging the use of portable projection systems in academic institutions. Increased connectivity and expanding digital learning platforms are also supporting the broader adoption of portable display devices. In addition, the growing prevalence of hybrid work arrangements and digital collaboration tools has created new opportunities for portable projection technologies across professional environments. Improvements in digital infrastructure have enabled greater access to online content, which further supports the use of portable projectors for both educational and workplace applications.
Major companies operating in the Global Portable Projector Market include AAXA Technologies, Acer, Anker (Nebula), ASUS, BenQ, Epson America, JMGO, LG Electronics, Optoma, Philips, Samsung, Sony, ViewSonic, Xiaomi, and XGIMI. Companies active in the Portable Projector Market are implementing several strategic initiatives to strengthen their competitive position and expand their market presence. Product innovation remains a central focus, with manufacturers investing in advanced display technologies that improve resolution, brightness, and overall image performance. Many companies are also developing compact designs that enhance portability while maintaining high visual quality. Strategic partnerships with technology distributors and retail networks help manufacturers increase product accessibility across global markets. In addition, companies are expanding their smart projector portfolios by integrating wireless connectivity, streaming capabilities, and mobile device compatibility. Continuous investment in research and development supports the introduction of improved projection systems that meet evolving consumer expectations.
Table of Contents
Chapter 1 Methodology & Scope
- 1.1 Market scope & definitions
- 1.2 Research design
- 1.2.1 Research approach
- 1.2.2 Data collection methods
- 1.3 Base estimates and calculations
- 1.3.1 Base year calculation
- 1.3.2 Market estimates & forecasts parameters
- 1.4 Forecast Model
- 1.4.1 Key trends for market estimates
- 1.4.2 Quantified market impact analysis
- 1.4.2.1 Mathematical impact of growth parameters on forecast
- 1.4.3 Scenario analysis framework
- 1.5 Primary research and validation
- 1.5.1 Some of the primary sources (but not limited to)
- 1.6 Data mining sources
- 1.6.1 Paid Sources
- 1.7 Primary research and validation
- 1.7.1 Primary sources
- 1.8 Research Trail & confidence scoring
- 1.8.1 Research trail components
- 1.8.2 Scoring components
- 1.9 Research transparency addendum
- 1.9.1 Source attribution framework
- 1.9.2 Quality assurance metrics
- 1.9.3 Our commitment to trust
- 1.10 Market Definitions
Chapter 2 Executive Summary
- 2.1 Industry 360° synopsis
- 2.2 Key market trends
- 2.2.1 Regional
- 2.2.2 Technology
- 2.2.3 Projector screen size
- 2.2.4 Connectivity
- 2.2.5 End use
- 2.2.6 Distribution channel
- 2.3 CXO perspectives: Strategic imperatives
- 2.3.1 Key decision points for industry executives
- 2.3.2 Critical success factors for market players
- 2.4 Future outlook and strategic recommendations
Chapter 3 Industry Insights
- 3.1 Industry ecosystem analysis
- 3.1.1 Supplier landscape
- 3.1.2 Profit margin
- 3.1.3 Value addition at each stage
- 3.1.4 Factor affecting the value chain
- 3.2 Industry impact forces
- 3.2.1 Growth drivers
- 3.2.1.1 Digitalization in education sector
- 3.2.1.2 Growing disposable income
- 3.2.1.3 Rise of online marketplaces
- 3.2.2 Industry pitfalls & challenges
- 3.2.2.1 Availability of alternative screen projection options and installed projectors
- 3.2.2.2 Brightness and image quality limitations
- 3.2.3 Opportunities
- 3.2.3.1 Rising demand across home entertainment & hybrid work
- 3.2.3.2 Integration of smart / IoT & AI-driven capabilities
- 3.2.1 Growth drivers
- 3.3 Growth potential analysis
- 3.4 Future market trends
- 3.5 Technology and innovation landscape
- 3.5.1 Current technological trends
- 3.5.2 Emerging technologies
- 3.6 Price trends
- 3.6.1 By type
- 3.6.2 By region
- 3.7 Regulatory landscape
- 3.7.1 North America
- 3.7.1.1 US: Consumer Product Safety Commission (CPSC) 16 Code of Federal Regulations (CFR) part 1512
- 3.7.1.2 Canada: International Organization for Standardization (ISO) 4210
- 3.7.2 Europe
- 3.7.2.1 Germany: Deutsches Institut fur Normung (DIN) European Norm (EN) ISO 4210
- 3.7.2.2 UK: European Norm (EN) ISO 4210 / United Kingdom Conformity Assessed (UKCA)
- 3.7.2.3 France: European Norm (EN) ISO 4210
- 3.7.3 Asia Pacific
- 3.7.3.1 China: Guobiao (GB) 3565
- 3.7.3.2 India: Indian Standard (IS) 10613
- 3.7.3.3 Japan: Japanese Industrial Standard (JIS) D 9110
- 3.7.4 Latin America
- 3.7.4.1 Brazil: Associacao Brasileira de Normas Tecnicas (ABNT) Norma Brasileira (NBR) ISO 4210
- 3.7.4.2 Mexico: International Organization for Standardization (ISO) 4210
- 3.7.5 Middle East & Africa
- 3.7.5.1 South Africa: South African National Standard (SANS) 311
- 3.7.5.2 Saudi Arabia: Saudi Standards, Metrology and Quality Organization (SASO) Gulf Standardization Organization (GSO) ISO 4210
- 3.7.1 North America
- 3.8 Trade data analysis
- 3.8.1 Import/export volume & value trends
- 3.8.2 Key trade corridors & tariff impact
- 3.9 Impact of AI & generative AI on the market
- 3.9.1 AI-driven disruption of existing business models
- 3.9.2 Genai use cases & adoption roadmap by segment
- 3.9.3 Risks, limitations & regulatory considerations
- 3.10 Porter's analysis
- 3.11 PESTEL analysis
- 3.12 Consumer behaviour analysis
- 3.12.1 Purchasing patterns
- 3.12.2 Preference analysis
- 3.12.3 Regional variations in consumer behaviour
- 3.12.4 Impact of e-commerce on buying decisions
Chapter 4 Competitive Landscape, 2025
- 4.1 Introduction
- 4.2 Company market share analysis
- 4.2.1 By region
- 4.2.1.1 North America
- 4.2.1.2 Europe
- 4.2.1.3 Asia Pacific
- 4.2.1.4 Latin America
- 4.2.1.5 Middle East and Africa
- 4.2.1 By region
- 4.3 Company matrix analysis
- 4.4 Competitive analysis of major market players
- 4.5 Competitive positioning matrix
- 4.6 Key developments
- 4.6.1 Mergers & acquisitions
- 4.6.2 Partnerships & collaborations
- 4.6.3 New product launches
- 4.6.4 Expansion plans
Chapter 5 Market Estimates & Forecast, By Technology, 2022 - 2035, (USD Billion) (Thousand Units)
- 5.1 Key trends
- 5.2 Digital light processing (DLP)
- 5.3 Liquid crystal display (LCD)
- 5.4 Liquid crystal on silicon (Locos)
- 5.5 Others
Chapter 6 Market Estimates & Forecast, By Projector Screen Size, 2022 - 2035, (USD Billion) (Thousand Units)
- 6.1 Key trends
- 6.2 Below 50 Inches
- 6.3 50 - 200 Inches
- 6.4 Above 200 Inches
Chapter 7 Market Estimates & Forecast, By Connectivity, 2022 - 2035, (USD Billion) (Thousand Units)
- 7.1 Key trends
- 7.2 Wired
- 7.3 Wireless
Chapter 8 Market Estimates & Forecast, By End Use, 2022 - 2035, (USD Billion) (Thousand Units)
- 8.1 Key trends
- 8.2 Home entertainment
- 8.3 Educational institutions
- 8.4 Business professionals
- 8.5 Gaming
- 8.6 Event organizers
- 8.7 Media production / content house
- 8.8 Others (lounges, clubs, sports center etc.)
Chapter 9 Market Estimates & Forecast, By Distribution Channel, 2022 - 2035, (USD Billion) (Thousand Units)
- 9.1 Key trends
- 9.2 Online
- 9.2.1 E-Commerce
- 9.2.2 Company websites
- 9.3 Offline
- 9.3.1 Specialty stores
- 9.3.2 Mega retail stores
- 9.3.3 Others
Chapter 10 Market Estimates & Forecast, By Region, 2022-2035 (USD Billion) (Thousand Units)
- 10.1 Key trends
- 10.2 North America
- 10.2.1 U.S.
- 10.2.2 Canada
- 10.3 Europe
- 10.3.1 Germany
- 10.3.2 France
- 10.3.3 UK
- 10.3.4 Italy
- 10.3.5 Spain
- 10.4 Asia Pacific
- 10.4.1 China
- 10.4.2 India
- 10.4.3 Japan
- 10.4.4 South Korea
- 10.4.5 Australia
- 10.5 Latin America
- 10.5.1 Brazil
- 10.5.2 Mexico
- 10.5.3 Argentina
- 10.6 MEA
- 10.6.1 South Africa
- 10.6.2 Saudi Arabia
- 10.6.3 UAE
Chapter 11 Company Profiles
- 11.1 AAXA Technologies
- 11.2 Acer
- 11.3 Anker (Nebula)
- 11.4 ASUS
- 11.5 BenQ
- 11.6 Epson America
- 11.7 JMGO
- 11.8 LG Electronics
- 11.9 Optoma
- 11.10 Philips
- 11.11 Samsung
- 11.12 Sony
- 11.13 ViewSonic
- 11.14 Xiaomi
- 11.15 XGIMI

