
PUBLISHER: Global Market Insights Inc. | PRODUCT CODE: 2019032

PUBLISHER: Global Market Insights Inc. | PRODUCT CODE: 2019032
Middle East and Africa Passenger Electric Vehicle Market Opportunity, Growth Drivers, Industry Trend Analysis, and Forecast 2026 - 2035
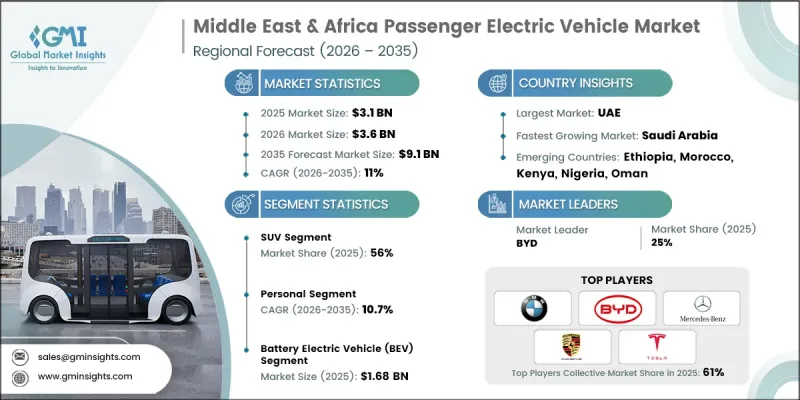
Middle East & Africa Passenger Electric Vehicle Market was valued at USD 3.1 billion in 2025 and is estimated to grow at a CAGR of 11% to reach USD 9.1 billion by 2035.
The industry is transitioning from an incentive-driven phase, where early users benefited from complimentary charging, toward a more structured paid charging ecosystem. Increasing fuel prices are positioning electric vehicles as a cost-efficient alternative when evaluated through total cost of ownership, strengthening consumer appeal. The region is also experiencing increased participation from international manufacturers, which is enhancing competition and expanding product availability. Governments are actively supporting this transition through infrastructure expansion and policy frameworks aimed at long-term economic diversification. Although the market experienced a temporary slowdown in early 2020 due to supply chain disruptions and economic uncertainty, recovery has been steady, and growth prospects remain strong. Continued investments in charging infrastructure, local assembly capabilities, and electrification strategies are expected to sustain adoption levels across the region over the coming decade.
| Market Scope | |
|---|---|
| Start Year | 2025 |
| Forecast Year | 2026-2035 |
| Start Value | $3.1 Billion |
| Forecast Value | $9.1 Billion |
| CAGR | 11% |
The market is expected to maintain consistent growth over the next five years following the pandemic-related disruptions. Regional governments are advancing electric mobility through national strategies, infrastructure funding, and initiatives designed to expand charging networks while encouraging domestic production capabilities.
The SUVs segment accounted for 56% share in 2025 and is projected to grow at a CAGR of 11.5% between 2026 and 2035. Consumer demand continues to favor larger vehicles that offer enhanced comfort, an elevated driving position, and suitability for diverse road conditions, reinforcing the dominance of this segment.
The battery electric vehicles segment reached USD 1.68 billion in 2025, leading the segment due to rising investments in manufacturing and assembly capabilities. Expanding local production is helping reduce costs, improve supply chain efficiency, and accelerate the adoption of fully electric mobility solutions.
UAE Passenger Electric Vehicle Market captured USD 2.12 billion in 2025. The country is emerging as a key production hub, supported by increasing industrial activity focused on electric mobility and ongoing efforts to enhance competitiveness within the sector.
Key companies operating in the Middle East & Africa Passenger Electric Vehicle Market include Audi, BMW, BYD, Hyundai, Kia, Mercedes-Benz, Nissan, Porsche, Tesla, and Volvo. Companies in the Middle East & Africa Passenger Electric Vehicle Market are focusing on expanding charging infrastructure networks to improve accessibility and reduce range anxiety among consumers. They are investing in localized manufacturing and assembly operations to lower production costs and strengthen supply chain resilience. Strategic partnerships and joint ventures are being pursued to accelerate technology transfer and market entry. Firms are also diversifying their product portfolios to align with regional consumer preferences, particularly in high-demand vehicle categories. In addition, companies are emphasizing digital integration, after-sales services, and financing solutions to enhance customer experience and retention. Pricing strategies and total cost of ownership positioning are being leveraged to attract cost-conscious buyers and improve overall market penetration.
Table of Contents
Chapter 1 Methodology & Scope
- 1.1 Research approach
- 1.2 Quality Commitments
- 1.2.1 GMI AI policy & data integrity commitment
- 1.2.1.1 Source consistency protocol
- 1.2.1 GMI AI policy & data integrity commitment
- 1.3 Research Trail & Confidence Scoring
- 1.3.1 Research Trail Components
- 1.3.2 Scoring Components
- 1.4 Data Collection
- 1.4.1 Partial list of primary sources
- 1.5 Data mining sources
- 1.5.1 Paid sources
- 1.5.1.1 Sources, by region
- 1.5.1 Paid sources
- 1.6 Base estimates and calculations
- 1.6.1 Base year calculation for any one approach
- 1.7 Forecast
- 1.7.1 Quantified market impact analysis
- 1.7.1.1 Mathematical impact of growth parameters on forecast
- 1.7.1 Quantified market impact analysis
- 1.8 Research transparency addendum
- 1.8.1 Source attribution framework
- 1.8.2 Quality assurance metrics
- 1.8.3 Our commitment to trust
Chapter 2 Executive Summary
- 2.1 Industry 360° synopsis
- 2.2 Key market trends
- 2.2.1 Regional
- 2.2.2 Drive
- 2.2.3 Propulsion
- 2.2.4 Vehicle
- 2.2.5 Application
- 2.2.6 Price
- 2.3 TAM Analysis, 2026-2035
- 2.4 CXO perspectives: Strategic imperatives
Chapter 3 Industry Insights
- 3.1 Industry ecosystem analysis
- 3.1.1 Supplier landscape
- 3.1.1.1 Battery Manufacturer
- 3.1.1.2 Component Supplier
- 3.1.1.3 OEM (Original Equipment Manufacturer)
- 3.1.1.4 Distributor / Deale
- 3.1.1.5 Battery Manufacturer
- 3.1.1.6 End user
- 3.1.2 Cost structure
- 3.1.3 Profit margin
- 3.1.4 Value addition at each stage
- 3.1.5 Vertical integration trends
- 3.1.6 Disruptors
- 3.1.1 Supplier landscape
- 3.2 Impact on forces
- 3.2.1 Growth drivers
- 3.2.1.1 Expansion of EV manufacturing hubs in Brazil and Mexico
- 3.2.1.2 Growing government incentives, subsidies, and tax benefits for EV
- 3.2.1.3 Rising environmental awareness and urban demand.
- 3.2.1.4 Increasing availability of affordable EV models
- 3.2.2 Industry pitfalls & challenges
- 3.2.2.1 Limited charging infrastructure in smaller cities and rural areas.
- 3.2.2.2 High upfront cost of EVs is relative to internal combustion vehicles.
- 3.2.3 Market opportunities
- 3.2.3.1 Premium EV segment expansion
- 3.2.3.2 Local battery production & supply chain development
- 3.2.1 Growth drivers
- 3.3 Technology trends & innovation ecosystem
- 3.3.1 Current technologies
- 3.3.2 Emerging technologies
- 3.4 Growth potential analysis
- 3.5 Regulatory landscape
- 3.5.1 United Arab Emirates (UAE)
- 3.5.1.1 Federal Transport Authority - Land and Maritime
- 3.5.1.2 Dubai Electricity and Water Authority (DEWA)
- 3.5.2 Saudi Arabia
- 3.5.2.1 Saudi Standards, Metrology and Quality Organization (SASO)
- 3.5.2.2 Saudi Energy Efficiency Center (SEEC)
- 3.5.3 South Africa
- 3.5.3.1 Department of Transport (DoT)
- 3.5.3.2 South African Bureau of Standards (SABS)
- 3.5.4 Qatar
- 3.5.4.1 Ministry of Transport and Communications (MOTC)
- 3.5.4.2 Public Works Authority (Ashghal)
- 3.5.5 Egypt
- 3.5.5.1 Ministry of Public Enterprise and Transport
- 3.5.5.2 Egyptian Organization for Standardization and Quality (EOS)
- 3.5.1 United Arab Emirates (UAE)
- 3.6 Porter's analysis
- 3.7 PESTEL analysis
- 3.8 Patent analysis (Driven by Primary Research)
- 3.9 Pricing Analysis (Driven by Primary Research)
- 3.9.1 Historical Price Trend Analysis
- 3.9.2 Pricing Strategy by Player Type
- 3.10 Capacity & Production Landscape (Driven by Primary Research)
- 3.10.1 Installed Capacity by Region & Key Producer
- 3.10.2 Capacity Utilization Rates & Expansion Pipelines
- 3.11 Trade Data Analysis (Driven by Primary Research)
- 3.11.1 Import/Export Volume & Value Trends
- 3.11.2 Key Trade Corridors & Tariff Impact
- 3.12 Sustainability and environmental aspects
- 3.12.1 Sustainable practices
- 3.12.2 Waste reduction strategies
- 3.12.3 Energy efficiency in production
- 3.12.4 Eco-friendly initiatives
- 3.12.5 Carbon footprint considerations
- 3.13 Impact of AI & generative AI on the market
- 3.13.1 AI-driven disruption of existing business models
- 3.13.1.1 Predictive Maintenance & Operations Optimization
- 3.13.1.2 Automated design optimization
- 3.13.1.3 Supply chain AI for demand forecasting
- 3.13.1.4 GenAI use cases & adoption roadmap by segment
- 3.13.1.4.1 Tread pattern design generation
- 3.13.1.4.2 Customer service chatbots & technical support
- 3.13.1.4.3 Marketing content creation
- 3.13.1.4.4 Risks, limitations & regulatory considerations
- 3.13.1.4.4.1 Data privacy in IoT-enabled smart products
- 3.13.1.4.4.2 AI algorithm transparency requirements
- 3.13.1.4.4.3 Liability in AI-driven product failures
- 3.13.1 AI-driven disruption of existing business models
- 3.14 Forecast assumptions & scenario analysis (Driven by Primary Research)
- 3.14.1 Base Case - key macro & industry variables driving CAGR
- 3.14.2 Optimistic Scenarios - Favorable Macro and Industry Tailwinds
- 3.14.3 Pessimistic Scenario - Macroeconomic slowdown or industry headwinds
Chapter 4 Competitive Landscape, 2025
- 4.1 Introduction
- 4.2 Company market share analysis
- 4.2.1 United Arab Emirates (UAE)
- 4.2.2 Saudi Arabia
- 4.2.3 South Africa
- 4.2.4 Qatar
- 4.2.5 Egypt
- 4.3 Competitive analysis of major market players
- 4.4 Competitive positioning matrix
- 4.5 Company Tier Benchmarking
- 4.5.1 Tier Classification Criteria & Qualifying Thresholds
- 4.5.2 Tier Positioning Matrix by Revenue, Geography & Innovation
- 4.6 Key developments
- 4.6.1 Mergers & acquisitions
- 4.6.2 Partnerships & collaborations
- 4.6.3 New product launches
- 4.6.4 Expansion plans and funding
Chapter 5 Market Estimates & Forecast, By Vehicle, 2022 - 2035 ($ Bn, Units)
- 5.1 Key trends
- 5.2 Hatchback
- 5.3 Sedan
- 5.4 SUV
- 5.5 Others
Chapter 6 Market Estimates & Forecast, By Drive , 2022 - 2035 ($ Bn, Units)
- 6.1 Key trends
- 6.2 Front-wheel drive
- 6.3 Rear-wheel drive
- 6.4 All-wheel drive
Chapter 7 Market Estimates & Forecast, By Propulsion, 2022 - 2035 ($ Bn, Units)
- 7.1 Key trends
- 7.2 Battery Electric Vehicle (BEV)
- 7.3 Fuel Cell Electric Vehicle (FCEV)
- 7.4 Plug-in Hybrid Electric Vehicle (PHEV)
Chapter 8 Market Estimates & Forecast, By Application, 2022 - 2035 ($ Bn, Units)
- 8.1 Key trends
- 8.2 Personal
- 8.3 Commercial
Chapter 9 Market Estimates & Forecast By Price, 2022 - 2035 ($ Bn, Units)
- 9.1 Key trends
- 9.2 Entry
- 9.3 Mid-Range
- 9.4 Luxury
Chapter 10 Market Estimates & Forecast, By Region, 2022 - 2035 ($ Bn, Units)
- 10.1 Key trends
- 10.2 United Arab Emirates (UAE)
- 10.3 Saudi Arabia
- 10.4 South Africa
- 10.5 Qatar
- 10.6 Egypt
- 10.7 Ethiopia
- 10.8 Morocco
- 10.9 Kenya
- 10.10 Nigeria
- 10.11 Oman
Chapter 11 Company Profiles
- 11.1 Global players
- 11.1.1 Audi
- 11.1.2 BMW
- 11.1.3 Chevrolet (GM)
- 11.1.4 Ford
- 11.1.5 Hyundai
- 11.1.6 Kia
- 11.1.7 Mercedes-Benz
- 11.1.8 Nissan
- 11.1.9 Porsche
- 11.1.10 Renault
- 11.1.11 Tesla
- 11.1.12 Volkswagen
- 11.1.13 Volvo
- 11.2 Regional players
- 11.2.1 BYD
- 11.2.2 Chery
- 11.2.3 Great Wall Motors
- 11.2.4 JAC Motors
- 11.2.5 MG (SAIC)
- 11.3 Emerging players
- 11.3.1 Ceer Motors
- 11.3.2 M Glory Holding
- 11.3.3 Elesco

