
PUBLISHER: Global Market Insights Inc. | PRODUCT CODE: 2019038

PUBLISHER: Global Market Insights Inc. | PRODUCT CODE: 2019038
Europe Inland Waterways Vessels Market Opportunity, Growth Drivers, Industry Trend Analysis, and Forecast 2026 - 2035
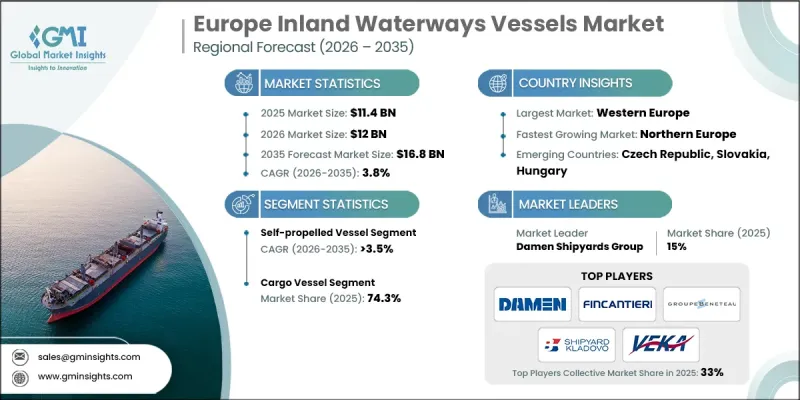
Europe Inland Waterways Vessels Market was valued at USD 11.4 billion in 2025 and is estimated to grow at a CAGR of 3.8% to reach USD 16.8 billion by 2035.
Market growth is driven by Europe's strong commitment to carbon neutrality and the steady shift of freight transport from road to inland water routes. Inland vessels generate significantly lower emissions per ton-kilometer compared to trucks, aligning with regional decarbonization targets and sustainability frameworks. As a result, logistics operators and public authorities are prioritizing waterborne freight corridors, fleet renewal programs, and the development of low-emission propulsion technologies. Investments are also being directed toward vessel replacement cycles and modernization initiatives to enhance energy efficiency. With increasing pressure to reduce congestion and environmental impact, inland waterways are becoming an essential component of Europe's multimodal freight network, supporting stable long-term vessel demand while reinforcing the competitiveness of inland shipping across the region.
| Market Scope | |
|---|---|
| Start Year | 2025 |
| Forecast Year | 2026-2035 |
| Start Value | $11.4 Billion |
| Forecast Value | $16.8 Billion |
| CAGR | 3.8% |
Ongoing upgrades to inland waterway infrastructure are strengthening year-round reliability, cargo capacity, and navigational efficiency across interconnected river and canal systems. Improvements such as lock enhancements, channel maintenance, terminal redevelopment, and stronger port linkages are reducing delays and increasing throughput volumes. These infrastructure advancements are making inland shipping more competitive with road and rail transport, thereby stimulating vessel investments and supporting sustained market expansion. Rapid digitalization is also transforming inland navigation, with advanced traffic coordination systems, real-time monitoring tools, automated navigation assistance, and predictive maintenance solutions improving safety and operational efficiency. Enhanced cargo visibility and better logistics coordination are increasing shipper confidence, leading to higher freight volumes and encouraging the adoption of technologically advanced inland vessels.
The self-propelled vessel segment held 80% share in 2025 and is expected to register a CAGR of 3.5% through 2035. Growing demand for autonomous-capable and self-powered vessels is supported by digital navigation technologies, advanced positioning systems, and collision-avoidance innovations. These capabilities enhance safety standards while reducing crew requirements and operational expenses. Logistics providers are increasingly investing in self-propelled vessels to benefit from automated routing, improved reliability, and faster turnaround times across major European transport corridors.
The cargo vessel segment accounted for 74.3% share in 2025 and is forecast to grow at a CAGR of 3.5% between 2026 and 2035. Rising intra-European trade and expanding industrial activity are increasing demand for vessels capable of transporting bulk commodities, containers, and specialized freight through inland waterways. Europe's interconnected river systems enable efficient long-distance cargo movement, reducing dependence on road transport. Growing freight volumes are positioning inland cargo vessels as a cost-effective foundation of regional supply chains, prompting newbuild orders tailored to evolving logistics requirements. The continued expansion of containerized freight distribution from coastal gateways to inland logistics centers is further strengthening demand for cargo vessels.
Germany Inland Waterways Vessels Market held 27% share, generating USD 2.1 billion in 2025. The country's extensive and well-integrated inland waterway network supports efficient freight movement between industrial hubs and international trade gateways. Increasing adoption of low-carbon logistics solutions is encouraging shippers to transition toward inland vessel transport, driving fleet expansion and new vessel procurement to maintain competitiveness within Europe's largest industrial economy. Inland freight demand in Germany is further supported by growth in key manufacturing industries, reinforcing the country's leadership position in the regional market.
Key companies operating in the Europe Inland Waterways Vessels Market include Barkmet Boats, China State Shipbuilding, Daewoo Shipbuilding & Marine Engineering, Damen Shipyards, Fincantieri, Groupe Beneteau, Hyundai Mipo Dockyard, MEYER WERFT, Shipyard Kladovo, VARD, and VEKA. Companies active in the Europe Inland Waterways Vessels Market are reinforcing their market position through fleet modernization, sustainability-focused innovation, and strategic partnerships. Leading manufacturers are investing in energy-efficient propulsion systems, hybrid and electric vessel platforms, and advanced hull designs to comply with evolving environmental standards. Many firms are strengthening collaborations with logistics operators and port authorities to secure long-term contracts and customized vessel orders. Digital integration is another core strategy, with shipbuilders incorporating smart navigation systems, automation features, and predictive maintenance capabilities to enhance operational performance.
Table of Contents
Chapter 1 Methodology
- 1.1 Research approach
- 1.2 Quality Commitments
- 1.2.1 GMI AI policy & data integrity commitment
- 1.2.1.1 Source consistency protocol
- 1.2.1 GMI AI policy & data integrity commitment
- 1.3 Research Trail & Confidence Scoring
- 1.3.1 Research Trail Components
- 1.3.2 Scoring Components
- 1.4 Data Collection
- 1.4.1 Partial list of primary sources
- 1.5 Data mining sources
- 1.5.1 Paid sources
- 1.5.2 Sources, by region
- 1.6 Base estimates and calculations
- 1.6.1 Base year calculation for any one approach
- 1.7 Forecast model
- 1.7.1 Quantified market impact analysis
- 1.7.1.1 Mathematical impact of growth parameters on forecast
- 1.7.1 Quantified market impact analysis
- 1.8 Research transparency addendum
- 1.8.1 Source attribution framework
- 1.8.2 Quality assurance metrics
- 1.8.3 Our commitment to trust
Chapter 2 Executive Summary
- 2.1 Industry 360° synopsis, 2022 - 2035
- 2.2 Key market trends
- 2.2.1 Regional
- 2.2.2 Vessel
- 2.2.3 Vehicle
- 2.2.4 Ownership
- 2.2.5 Propulsion
- 2.2.6 Fuel
- 2.2.7 Engine Rating
- 2.2.8 Vessel Length
- 2.2.9 Gross Tonnage
- 2.3 TAM Analysis, 2026-2035
- 2.4 CXO perspectives: Strategic imperatives
Chapter 3 Industry Insights
- 3.1 Industry ecosystem analysis
- 3.1.1 Supplier landscape
- 3.1.2 Profit margin analysis
- 3.1.3 Cost structure
- 3.1.4 Value addition at each stage
- 3.1.5 Factor affecting the value chain
- 3.1.6 Disruptions
- 3.2 Industry impact forces
- 3.2.1 Growth drivers
- 3.2.1.1 Modal shift toward low-carbon freight transport
- 3.2.1.2 TEN-T infrastructure modernization
- 3.2.1.3 Digital navigation & fleet optimization
- 3.2.1.4 Growth in containerized & intermodal transport
- 3.2.1.5 Fleet renewal & green propulsion adoption
- 3.2.2 Industry pitfalls and challenges
- 3.2.2.1 Aging fleet & high retrofit costs
- 3.2.2.2 Seasonal water level fluctuations
- 3.2.2.3 Stringent environmental regulations
- 3.2.2.4 Competition from rail & road logistics
- 3.2.3 Market opportunities
- 3.2.3.1 Hydrogen & electric propulsion deployment
- 3.2.3.2 Cross-border trade integration
- 3.2.3.3 Smart port & terminal automation
- 3.2.3.4 Eastern Europe waterway revitalization
- 3.2.1 Growth drivers
- 3.3 Growth potential analysis
- 3.4 Regulatory landscape
- 3.4.1 Western Europe
- 3.4.1.1 EU Green Deal & Fit for 55 Maritime Provisions
- 3.4.1.2 Stage V Inland Waterway Vessel Emission Standards
- 3.4.1.3 Rhine Vessel Inspection Regulations (CCNR Standards)
- 3.4.2 Eastern Europe
- 3.4.2.1 EU Cohesion Fund for Inland Waterway Modernization
- 3.4.2.2 Danube Commission Navigation Safety Regulations
- 3.4.2.3 National Fleet Renewal & Emission Compliance Programs
- 3.4.3 Northern Europe
- 3.4.3.1 Alternative Fuels Infrastructure Regulation for Inland Ports
- 3.4.3.2 National Subsidies for Zero-Emission Inland Vessels
- 3.4.3.3 Low-Emission Waterway & Port Zone Regulations
- 3.4.4 Southern Europe
- 3.4.4.1 TEN-T Inland Waterway Infrastructure Requirements
- 3.4.4.2 National Emission Control & Diesel Phase-Down Policies
- 3.4.4.3 Regional Green Shipping Incentives & Modernization Grants
- 3.4.1 Western Europe
- 3.5 PESTEL analysis
- 3.6 Technology and Innovation landscape
- 3.6.1 Current technological trends
- 3.6.2 Emerging technologies
- 3.7 Patent analysis
- 3.8 Production statistics
- 3.8.1 Production hubs
- 3.8.2 Consumption hubs
- 3.8.3 Export and import
- 3.9 Pricing Analysis
- 3.9.1 By region
- 3.9.2 By Product
- 3.10 Cost analysis & total cost of ownership (TCO)
- 3.10.1 CapEx & OpEx comparison (Diesel vs Electric)
- 3.10.2 Purchase incentives & subsidies
- 3.10.3 Battery replacement costs
- 3.10.4 Maintenance & operational savings
- 3.11 Sustainability and environmental impact analysis
- 3.11.1 Sustainable practices
- 3.11.2 Waste reduction strategies
- 3.11.3 Energy efficiency in production
- 3.11.4 Eco-friendly initiatives
- 3.11.5 Carbon footprint considerations
- 3.12 Future outlook & opportunities
- 3.13 Investment & funding landscape
- 3.13.1 Public funding programs
- 3.13.2 Private investments & partnerships
- 3.14 Fleet adoption & usage patterns
- 3.14.1 Fleet size & deployment
- 3.14.2 Fleet electrification roadmap
- 3.14.3 Total fleet cost savings
Chapter 4 Competitive Landscape, 2025
- 4.1 Introduction
- 4.2 Company market share analysis
- 4.2.1 Western Europe
- 4.2.2 Eastern Europe
- 4.2.3 Northern Europe
- 4.2.4 Southern Europe
- 4.3 Fleet size, by operator, 2022-2035 (20 operators)
- 4.4 Fleet size, by river basin, 2022-2035
- 4.4.1 Rhine basin
- 4.4.2 Danube basin
- 4.4.3 Rhone-Saone basin
- 4.4.4 Seine basin
- 4.4.5 Elbe basin
- 4.4.6 Oder basin
- 4.4.7 Vistula basin
- 4.4.8 Po basin
- 4.4.9 Douro basin
- 4.5 Competitive analysis of major market players
- 4.6 Competitive positioning matrix
- 4.7 Strategic outlook matrix
- 4.8 Key developments
- 4.8.1 Mergers & acquisitions
- 4.8.2 Partnerships & collaborations
- 4.8.3 New Product Launches
- 4.8.4 Expansion Plans and funding
Chapter 5 Market Estimates & Forecast, By Vessel, 2022 - 2035 ($Bn, Unit)
- 5.1 Key trends
- 5.2 Cargo vessel
- 5.2.1 Dry bulk barges
- 5.2.2 Container barges
- 5.2.3 Mixed cargo barges
- 5.3 Tank barges
- 5.4 Passenger vessels
- 5.5 Support and service vessels
- 5.6 River-sea vessels
- 5.7 ADN-Compliant Dangerous Goods Vessels
Chapter 6 Market Estimates & Forecast, By Vehicle, 2022 - 2035 ($Bn, Unit)
- 6.1 Key trends
- 6.2 Pusher
- 6.3 Self-propelled Vessel
- 6.4 Ro-ro inland vessels
- 6.5 Survey vessels
Chapter 7 Market Estimates & Forecast, By Ownership, 2022 - 2035 ($Bn, Unit)
- 7.1 Key trends
- 7.2 Government
- 7.3 Commercial
Chapter 8 Market Estimates & Forecast, By Propulsion, 2022 - 2035 ($Bn, Unit)
- 8.1 Key trends
- 8.2 Diesel-mechanical
- 8.3 Diesel-electric
- 8.4 Diesel-hydraulic
- 8.5 LNG dual-fuel
- 8.6 Hydrogen fuel cell
- 8.7 Battery-electric
- 8.8 Hybrid (diesel-electric-battery)
Chapter 9 Market Estimates & Forecast, By Fuel, 2022 - 2035 ($Bn, Unit)
- 9.1 Key trends
- 9.2 Diesel (MGO/gasoil)
- 9.3 Heavy fuel oil (HFO)
- 9.4 LNG
- 9.5 Hydrogen
- 9.6 Methanol
- 9.7 Battery-electric
- 9.8 Hybrid (multiple fuels)
- 9.9 Biodiesel/HVO
- 9.10 Others
Chapter 10 Market Estimates & Forecast, By Engine Rating, 2022 - 2035 ($Bn, Unit)
- 10.1 Key trends
- 10.2 Very low (<200 kW)
- 10.3 Low (200-500 kW)
- 10.4 Medium (500-1,500 kW)
- 10.5 High (1,500-3,000 kW)
- 10.6 Very high (3,000-6,000 kW)
- 10.7 Extra high (>6,000 kW)
Chapter 11 Market Estimates & Forecast, By Vessel Length, 2022 - 2035 ($Bn, Unit)
- 11.1 Key trends
- 11.2 Small (<50 m)
- 11.3 Medium (50-85 m)
- 11.4 Large (85-110 m)
- 11.5 Extra large (110-135 m)
- 11.6 Mega (>135 m)
Chapter 12 Market Estimates & Forecast, By Gross Tonnage, 2022 - 2035 ($Bn, Unit)
- 12.1 Key trends
- 12.2 Micro (<500 GT)
- 12.3 Small (500-1,500 GT)
- 12.4 Medium (1,500-3,000 GT)
- 12.5 Large (3,000-5,000 GT)
- 12.6 Extra-large (>5,000 GT)
Chapter 13 Market Estimates & Forecast, By Region, 2022 - 2035 ($Bn, Units)
- 13.1 Key trends
- 13.2 Western Europe
- 13.2.1 Germany
- 13.2.2 Austria
- 13.2.3 France
- 13.2.4 Switzerland
- 13.2.5 Belgium
- 13.2.6 Luxembourg
- 13.2.7 Netherlands
- 13.2.8 Portugal
- 13.3 Eastern Europe
- 13.3.1 Poland
- 13.3.2 Romania
- 13.3.3 Czechia
- 13.3.4 Slovenia
- 13.3.5 Hungary
- 13.3.6 Bulgaria
- 13.3.7 Slovakia
- 13.3.8 Croatia
- 13.4 Northern Europe
- 13.4.1 UK
- 13.4.2 Denmark
- 13.4.3 Sweden
- 13.4.4 Finland
- 13.4.5 Norway
- 13.5 Southern Europe
- 13.5.1 Italy
- 13.5.2 Spain
- 13.5.3 Greece
- 13.5.4 Bosnia and Herzegovina
- 13.5.5 Albania
Chapter 14 Company Profiles
- 14.1 Global
- 14.1.1 China State Shipbuilding
- 14.1.2 Daewoo Shipbuilding & Marine Engineering
- 14.1.3 Damen Shipyards
- 14.1.4 Fincantieri
- 14.1.5 Groupe Beneteau
- 14.1.6 Hyundai Mipo Dockyard
- 14.1.7 MEYER WERFT
- 14.1.8 VARD
- 14.2 Regional
- 14.2.1 Barkmet Boats
- 14.2.2 Bodewes Shipyards
- 14.2.3 Concordia Damen
- 14.2.4 De Hoop Shipyards
- 14.2.5 Mercurius Shipbuilding
- 14.2.6 Shipyard Kladovo
- 14.2.7 TeamCo Shipyard
- 14.2.8 Vahali Shipyards
- 14.2.9 VEKA Group
- 14.3 Emerging
- 14.3.1 Arminius Shipyard
- 14.3.2 Baltic Workboats
- 14.3.3 Centromost
- 14.3.4 GS Yard
- 14.3.5 Rupelmonde Shipyard

