
PUBLISHER: Global Market Insights Inc. | PRODUCT CODE: 2019069

PUBLISHER: Global Market Insights Inc. | PRODUCT CODE: 2019069
Marine Chartplotter Market Opportunity, Growth Drivers, Industry Trend Analysis, and Forecast 2026 - 2035
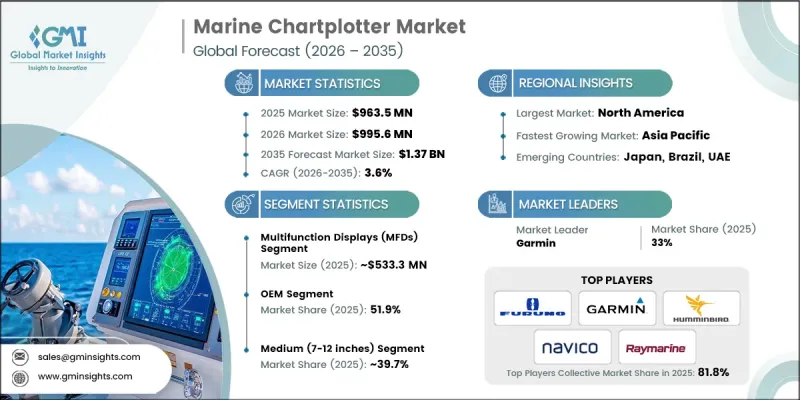
The Global Marine Chartplotter Market was valued at USD 963.5 million in 2025 and is estimated to grow at a CAGR of 3.6% to reach USD 1.37 billion by 2035.
The global marine chartplotter market is closely influenced by trends in vessel production, as increased shipbuilding activity drives demand for onboard navigation equipment. These systems play a critical role in supporting accurate positioning and route optimization, making them indispensable across both commercial and recreational marine applications. Growing investments in advanced display technologies and enhanced connectivity are shaping the evolution of chartplotters. In addition, regulatory frameworks are encouraging the adoption of electronic navigation systems, supporting consistent upgrades and long-term deployment of digital tools. As maritime operations become more reliant on data-driven navigation, chartplotters are increasingly integrated into broader onboard systems, improving operational efficiency and safety while supporting seamless navigation experiences.
| Market Scope | |
|---|---|
| Start Year | 2025 |
| Forecast Year | 2026-2035 |
| Start Value | $963.5 Million |
| Forecast Value | $1.37 Billion |
| CAGR | 3.6% |
The marine chartplotter market is also advancing through continuous technological improvements that enhance usability and system integration. Modern devices feature high-resolution interfaces, wireless connectivity, and compatibility with onboard communication networks. These systems enable seamless data exchange and support advanced functionalities, including remote updates and integration with multiple onboard data sources. Commercial operators rely on these technologies to maintain navigation accuracy and meet regulatory requirements, while recreational users are increasingly drawn to intuitive interfaces and real-time information. The growing popularity of multifunction systems that combine navigation with additional capabilities is further contributing to market expansion.
In 2025, the multifunction displays segment accounted for 55.3% share, generating USD 533.3 million. This segment leads the market due to the increasing preference for integrated navigation solutions that consolidate multiple functions into a single interface. These systems combine various operational inputs into a unified display, reducing the need for separate instruments and improving efficiency. Their compatibility with onboard communication networks and integrated system architectures has further strengthened their adoption across modern vessels.
The medium-sized segment, ranging from 7 to 12 inches, held a 39.7% share in 2025 and is expected to grow at the fastest CAGR of 4.5% between 2026 and 2035. These devices are widely preferred due to their balanced combination of display clarity and space efficiency. They provide sufficient screen area for clear data visualization while maintaining compact dimensions suitable for standard control setups. Their ability to support multiple data views simultaneously enhances usability, making them a practical choice for a wide range of marine applications.
United States Marine Chartplotter Market reached USD 269.4 million in 2025 and is expected to grow at a CAGR of 3.9% through 2035. The country represents a key market driven by strong maritime activity and continuous investment in navigation technologies. Regulatory frameworks supporting digital navigation systems are encouraging widespread adoption of advanced chartplotting solutions. Ongoing initiatives focused on improving maritime safety and operational efficiency are also contributing to increased demand. The integration of digital navigation tools into maritime operations is reinforcing the growth of the marine chartplotter market across the region.
Key companies operating in the Global Marine Chartplotter Market include Furuno Electric, Garmin, Humminbird, Japan Radio, Koden Electronics, Navico, Raymarine, Samyung, SI-TEX Marine, and Standard Horizon (Yaesu). Companies in the Marine Chartplotter Market are strengthening their competitive position through innovation, product integration, and strategic expansion. They are investing in advanced display technologies, enhanced connectivity, and software-driven navigation features to improve user experience and operational efficiency. Partnerships with vessel manufacturers and marine system integrators are enabling deeper integration of chartplotters into onboard systems. Companies are also focusing on expanding their global presence through distribution networks and localized support services. Additionally, continuous upgrades in user interface design, real-time data processing, and compatibility with evolving marine communication standards help companies differentiate their offerings and maintain a strong foothold in a competitive market.
Table of Contents
Chapter 1 Methodology
- 1.1 Research approach
- 1.2 Quality commitments
- 1.3 Research trail and confidence scoring
- 1.3.1 Research trail components
- 1.3.2 Scoring components
- 1.4 Data collection
- 1.4.1 Partial list of primary sources
- 1.5 Data mining sources
- 1.5.1 Paid sources
- 1.6 Best estimates and calculations
- 1.6.1 Base year calculation for any one approach
- 1.7 Forecast model
- 1.8 Research transparency addendum
Chapter 2 Executive Summary
- 2.1 Industry 360° synopsis, 2022 - 2035
- 2.2 Key market trends
- 2.2.1 Regional
- 2.2.2 Component
- 2.2.3 Module
- 2.2.4 Vehicle
- 2.2.5 Sales Channel
- 2.2.6 Application
- 2.3 TAM Analysis, 2026-2035
- 2.4 CXO perspectives: Strategic imperatives
Chapter 3 Industry Insights
- 3.1 Industry ecosystem analysis
- 3.1.1 Supplier landscape
- 3.1.2 Profit margin analysis
- 3.1.3 Cost structure
- 3.1.4 Value addition at each stage
- 3.1.5 Factor affecting the value chain
- 3.1.6 Disruptions
- 3.2 Industry impact forces
- 3.2.1 Growth drivers
- 3.2.1.1 Rapid electrification of vehicle fleets and transition to EVs/HEVs
- 3.2.1.2 Increasing electronic content in modern vehicles (ADAS, infotainment, connectivity)
- 3.2.1.3 Adoption of zone architecture and smart power distribution solutions
- 3.2.1.4 Stringent emission regulations driving high-voltage system integration
- 3.2.1.5 Consumer demand for advanced safety and comfort features
- 3.2.2 Industry pitfalls and challenges
- 3.2.2.1 High cost of advanced power distribution modules
- 3.2.2.2 Complexity in design & integration of multi-voltage systems
- 3.2.2.3 Semiconductor supply chain disruptions & component shortages
- 3.2.2.4 Thermal management challenges in compact vehicle spaces
- 3.2.3 Market opportunities
- 3.2.3.1 Expansion of 48V mild hybrid systems in passenger vehicles
- 3.2.3.2 Retrofitting aftermarket smart PDM solutions
- 3.2.3.3 Emerging markets automotive production growth
- 3.2.3.4 Integration with vehicle-to-grid (V2G) infrastructure
- 3.2.3.5 Development of modular & scalable PDM platforms
- 3.2.1 Growth drivers
- 3.3 Growth potential analysis
- 3.4 Regulatory landscape
- 3.4.1 North America
- 3.4.1.1 US- EPA GHG phase 3 & CAFE standards
- 3.4.1.2 Canada - Emissions-based regulatory framework
- 3.4.2 Europe
- 3.4.2.1 Germany- Euro 7 Emission Standards
- 3.4.2.2 UK- Post-brexit vehicle type approval
- 3.4.2.3 France- Decarbonization roadmap
- 3.4.2.4 Italy- Low-Emission zone compliance
- 3.4.3 Asia Pacific
- 3.4.3.1 China- China VI-b & Emerging China VII standards
- 3.4.3.2 India- BS-VI Stage II & bharat stage VII transition
- 3.4.3.3 Japan- Fuel efficiency standards (2030 Targets)
- 3.4.3.4 Australia- Fuel quality & ADR 79/05 standards
- 3.4.4 LATAM
- 3.4.4.1 Mexico- NOM-194-SE-2021 & USMCA rules of origin
- 3.4.4.2 Argentina- Law 24.449 & environmental amendments
- 3.4.5 MEA
- 3.4.5.1 South Africa- National road traffic act (1996)
- 3.4.5.2 Saudi Arabia- Traffic law & vision 2030 transport initiatives
- 3.4.1 North America
- 3.5 Porter's analysis
- 3.6 PESTEL analysis
- 3.7 Technology and innovation landscape
- 3.7.1 Current technological trends
- 3.7.2 Emerging technologies
- 3.8 Patent landscape (driven by primary research)
- 3.9 Pricing analysis (Driven by Primary Research)
- 3.9.1 Historical price trend analysis
- 3.9.2 Pricing strategy by player type (premium / value / cost-plus)
- 3.9.3 Total cost of ownership (TCO) analysis
- 3.10 Trade data analysis (driven by paid database)
- 3.10.1 Import/export volume & value trends
- 3.10.2 Key trade corridors & tariff impact
- 3.11 Use cases & success stories
- 3.12 Impact of AI & generative AI on the market
- 3.12.1 AI-driven disruption of existing business models
- 3.12.2 GenAI use cases & adoption roadmap by segment
- 3.12.3 Risks, limitations & regulatory considerations
- 3.13 Capacity & production landscape (driven by primary research)
- 3.13.1 Installed capacity by region & key producer
- 3.13.2 Capacity utilization rates & expansion pipelines
- 3.14 Sustainability and environmental aspects
- 3.14.1 Sustainable practices
- 3.14.2 Waste reduction strategies
- 3.14.3 Energy efficiency in production
- 3.14.4 Eco-friendly Initiatives
- 3.14.5 Carbon footprint considerations
- 3.15 Forecast assumptions & scenario analysis (Driven by primary research)
- 3.15.1 Base Case - key macro & industry variables driving CAGR
- 3.15.2 Optimistic Scenarios - Favorable macro and industry tailwinds
- 3.15.3 Pessimistic Scenario - Macroeconomic slowdown or industry headwinds
Chapter 4 Competitive Landscape, 2025
- 4.1 Introduction
- 4.2 Company market share analysis
- 4.2.1 North America
- 4.2.2 Europe
- 4.2.3 Asia Pacific
- 4.2.4 LATAM
- 4.2.5 MEA
- 4.3 Competitive analysis of major market players
- 4.4 Competitive positioning matrix
- 4.5 Company Tier Benchmarking
- 4.5.1 Tier Classification Criteria & Qualifying Thresholds
- 4.5.2 Tier Positioning Matrix by Revenue, Geography & Innovation
- 4.6 Key developments
- 4.6.1 Mergers & acquisitions
- 4.6.2 Partnerships & collaborations
- 4.6.3 New product launches
- 4.6.4 Expansion plans and funding
Chapter 5 Market Estimates & Forecast, By Component, 2022 - 2035 ($Bn, Units)
- 5.1 Key trends
- 5.2 Power modules
- 5.3 Fuses and circuit breakers
- 5.4 Connectors and terminals
- 5.5 Relays
- 5.6 Voltage regulators
- 5.7 Others
Chapter 6 Market Estimates & Forecast, By Module, 2022 - 2035 ($Bn, Units)
- 6.1 Key trends
- 6.2 Low voltage
- 6.3 Medium voltage
- 6.4 High voltage
Chapter 7 Market Estimates & Forecast, By Vehicle, 2022 - 2035 ($Bn, Units)
- 7.1 Key trends
- 7.2 Passenger cars
- 7.2.1 Hatchback
- 7.2.2 Sedan
- 7.2.3 SUV
- 7.3 Commercial vehicles
- 7.3.1 Light commercial vehicles (LCVs)
- 7.3.2 Medium commercial vehicles (MCVs)
- 7.3.3 Heavy commercial vehicles (HCVs)
Chapter 8 Market Estimates & Forecast, By Sales Channel, 2022 - 2035 ($Bn, Units)
- 8.1 Key trends
- 8.2 OEM
- 8.3 Aftermarket
Chapter 9 Market Estimates & Forecast, By Application, 2022 - 2035 ($Bn, Units)
- 9.1 Key trends
- 9.2 Lighting systems
- 9.3 Infotainment systems
- 9.4 HVAC systems
- 9.5 Safety and driver assistance systems
- 9.6 Powertrain systems
- 9.7 Battery management systems
- 9.8 Others
Chapter 10 Market Estimates & Forecast, By Region, 2022 - 2035 ($Bn, Units)
- 10.1 Key trends
- 10.2 North America
- 10.2.1 US
- 10.2.2 Canada
- 10.3 Europe
- 10.3.1 Germany
- 10.3.2 UK
- 10.3.3 France
- 10.3.4 Italy
- 10.3.5 Spain
- 10.3.6 Russia
- 10.3.7 Netherlands
- 10.3.8 Sweden
- 10.3.9 Denmark
- 10.3.10 Poland
- 10.4 Asia Pacific
- 10.4.1 China
- 10.4.2 India
- 10.4.3 Japan
- 10.4.4 Australia
- 10.4.5 South Korea
- 10.4.6 Singapore
- 10.4.7 Thailand
- 10.4.8 Indonesia
- 10.4.9 Vietnam
- 10.5 Latin America
- 10.5.1 Brazil
- 10.5.2 Mexico
- 10.5.3 Argentina
- 10.5.4 Colombia
- 10.6 MEA
- 10.6.1 South Africa
- 10.6.2 Saudi Arabia
- 10.6.3 UAE
- 10.6.4 Israel
Chapter 11 Company Profiles
- 11.1 Global Players
- 11.1.1 Aptiv
- 11.1.2 Continental
- 11.1.3 Denso
- 11.1.4 Eaton
- 11.1.5 Hitachi Astemo
- 11.1.6 Lear
- 11.1.7 Mitsubishi Electric
- 11.1.8 Robert Bosch
- 11.1.9 TE Connectivity
- 11.1.10 Valeo
- 11.2 Regional Players
- 11.2.1 DRAXLMAIER
- 11.2.2 Furukawa Electric
- 11.2.3 Leoni
- 11.2.4 Panasonic Automotive Systems
- 11.2.5 Sumitomo Electric Industries
- 11.2.6 Yazaki
- 11.3 Emerging Players
- 11.3.1 Infineon Technologies
- 11.3.2 NXP Semiconductors
- 11.3.3 onsemi (ON Semiconductor)
- 11.3.4 STMicroelectronics

