
PUBLISHER: Global Market Insights Inc. | PRODUCT CODE: 2019100

PUBLISHER: Global Market Insights Inc. | PRODUCT CODE: 2019100
Edible Oils and Fats Market Opportunity, Growth Drivers, Industry Trend Analysis, and Forecast 2026 - 2035
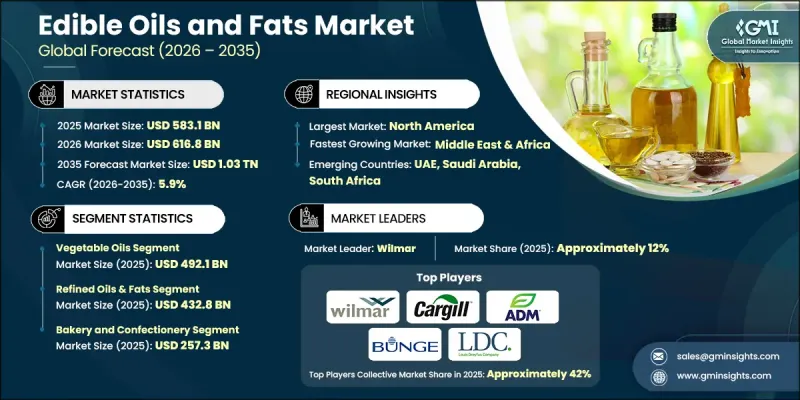
The Global Edible Oils and Fats Market was valued at USD 583.1 billion in 2025 and is estimated to grow at a CAGR of 5.9% to reach USD 1.03 trillion by 2035.
Edible oils and fats, derived from both plant sources such as soybean, olive, and palm oils, and animal sources like butter and lard, play a vital role in cooking, baking, and food manufacturing. They contribute flavor, texture, and nutritional benefits while serving as key ingredients across processed foods, snacks, confectionery, and other culinary applications. Rising consumer preference for healthier oils high in unsaturated fats, such as olive, sunflower, and canola, is driving market expansion, while affordability and versatility sustain demand for palm oil. The popularity of vegan and plant-based diets is encouraging the shift from animal fats to plant oils. Additionally, growing interest in organic, non-GMO, and sustainably sourced products is prompting manufacturers to adopt eco-friendly production practices, catering to evolving consumer priorities and expanding global market opportunities.
| Market Scope | |
|---|---|
| Start Year | 2025 |
| Forecast Year | 2026-2035 |
| Start Value | $583.1 Billion |
| Forecast Value | $1.03 Trillion |
| CAGR | 5.9% |
The vegetable oils segment was valued at USD 492.1 billion in 2025 and is expected to grow at a CAGR of 10.1% during 2026-2035. Rising demand for plant-based options, clean-label products, and healthier cooking alternatives is driving the growth of this segment. Its widespread application in packaged foods, bakery products, confectionery products, and foodservice operations ensures steady adoption. Fortified and cold-pressed products are increasingly favored by consumers, sustaining long-term growth in retail and commercial channels.
The refined oils and fats segment accounted for USD 432.8 billion in 2025 and is anticipated to grow at a CAGR of 6.1% through 2035. Its consistent quality, extended shelf life, and adaptability across cooking methods make it popular among households and the food industry. Refining processes enhance purity and standardize flavor profiles, meeting consumer demand for safe, reliable, and high-quality oils suitable for daily use.
North America Edible Oils and Fats Market generated USD 196.4 billion in 2025, driven by demand from processed foods, baked goods, and convenience meals. Consumers are increasingly seeking low-trans-fat, plant-based, and clean-label products, prompting manufacturers to focus on healthier formulations and diversified retail distribution.
Key players in the Global Edible Oils and Fats Market include ADM, Fuji Oil, Wilmar, ACH Food Companies, Louis Dreyfus Company, GrainCorp, Bunge, Cargill, IOI Corporation, Nisshin Oillio, among others. Companies in the Edible Oils and Fats Market are pursuing strategies such as expanding production capacity, investing in advanced extraction and refining technologies, and enhancing supply chain efficiency to strengthen market presence. Product diversification, including plant-based, cold-pressed, and fortified oils, allows firms to target health-conscious and premium consumer segments. Sustainability initiatives, such as eco-friendly sourcing and reduced carbon footprint practices, are increasingly prioritized. Strategic partnerships with food manufacturers and retailers secure long-term distribution channels, while research and development focus on improving oil quality, flavor consistency, and shelf life to meet evolving consumer expectations. These approaches help companies maintain competitiveness and drive market growth.
Table of Contents
Chapter 1 Methodology
- 1.1 Market scope and definition
- 1.2 Research design
- 1.2.1 Research approach
- 1.2.2 Data collection methods
- 1.3 Data mining sources
- 1.3.1 Global
- 1.3.2 Regional/Country
- 1.4 Base estimates and calculations
- 1.4.1 Base year calculation
- 1.4.2 Key trends for market estimation
- 1.5 Primary research and validation
- 1.5.1 Primary sources
- 1.6 Forecast model
- 1.7 Research assumptions and limitations
Chapter 2 Executive Summary
- 2.1 Industry 360° synopsis
- 2.2 Key market trends
- 2.2.1 Regional
- 2.2.2 Type
- 2.2.3 Processing Type
- 2.2.4 Application
- 2.3 TAM Analysis, 2026-2035
- 2.4 CXO perspectives: Strategic imperatives
Chapter 3 Industry Insights
- 3.1 Industry ecosystem analysis
- 3.1.1 Supplier Landscape
- 3.1.2 Profit Margin
- 3.1.3 Value addition at each stage
- 3.1.4 Factor affecting the value chain
- 3.1.5 Disruptions
- 3.2 Industry impact forces
- 3.2.1 Growth drivers
- 3.2.2 Industry pitfalls and challenges
- 3.2.3 Market opportunities
- 3.3 Growth potential analysis
- 3.4 Regulatory landscape
- 3.4.1 North America
- 3.4.2 Europe
- 3.4.3 Asia Pacific
- 3.4.4 Latin America
- 3.4.5 Middle East & Africa
- 3.5 Porter's analysis
- 3.6 PESTEL analysis
- 3.7 Price trends
- 3.7.1 By region
- 3.7.2 By product
- 3.8 Future market trends
- 3.9 Technology and Innovation landscape
- 3.9.1 Current technological trends
- 3.9.2 Emerging technologies
- 3.10 Patent Landscape
- 3.11 Trade statistics
- 3.11.1 Major importing countries
- 3.11.2 Major exporting countries
- 3.12 Sustainability and Environmental Aspects
- 3.12.1 Sustainable Practices
- 3.12.2 Waste Reduction Strategies
- 3.12.3 Energy Efficiency in Production
- 3.12.4 Eco-friendly Initiatives
- 3.13 Carbon Footprint Considerations
Chapter 4 Competitive Landscape, 2025
- 4.1 Introduction
- 4.2 Company market share analysis
- 4.2.1 By region
- 4.2.1.1 North America
- 4.2.1.2 Europe
- 4.2.1.3 Asia Pacific
- 4.2.1.4 LATAM
- 4.2.1.5 MEA
- 4.2.1 By region
- 4.3 Company matrix analysis
- 4.4 Competitive analysis of major market players
- 4.5 Competitive positioning matrix
- 4.6 Key developments
- 4.6.1 Mergers & acquisitions
- 4.6.2 Partnerships & collaborations
- 4.6.3 New Product Launches
- 4.6.4 Expansion Plans
Chapter 5 Market Estimates and Forecast, By Type, 2022- 2035 (USD Billion, Kilo Tons)
- 5.1 Key trends
- 5.2 Vegetable oils
- 5.2.1 Palm oil
- 5.2.2 Soybean oil
- 5.2.3 Rapeseed oil
- 5.2.4 Mustard oil
- 5.2.5 Coconut oil
- 5.3 Animal fats
- 5.3.1 Tallow
- 5.3.2 Lard
- 5.3.3 Ghee
- 5.3.4 Others
Chapter 6 Market Estimates and Forecast, By Processing Type, 2022- 2035 (USD Billion, Kilo Tons)
- 6.1 Key trends
- 6.2 Virgin/Cold-Pressed Oils
- 6.3 Refined Oils & Fats
- 6.4 Modified Fats
Chapter 7 Market Estimates and Forecast, By Application, 2022 - 2035 (USD Billion, Kilo Tons)
- 7.1 Key trends
- 7.2 Bakery and Confectionery
- 7.3 Snacks
- 7.4 Meat products
- 7.5 Others
Chapter 8 Market Estimates and Forecast, By Region, 2022 - 2035 (USD Billion, Kilo Tons)
- 8.1 Key trends
- 8.2 North America
- 8.2.1 U.S.
- 8.2.2 Canada
- 8.3 Europe
- 8.3.1 Germany
- 8.3.2 UK
- 8.3.3 France
- 8.3.4 Italy
- 8.3.5 Spain
- 8.3.6 Rest of Europe
- 8.4 Asia Pacific
- 8.4.1 China
- 8.4.2 India
- 8.4.3 Japan
- 8.4.4 Australia
- 8.4.5 South Korea
- 8.4.6 Rest of Asia Pacific
- 8.5 Latin America
- 8.5.1 Brazil
- 8.5.2 Mexico
- 8.5.3 Argentina
- 8.5.4 Rest of Latin America
- 8.6 Middle East & Africa
- 8.6.1 Saudi Arabia
- 8.6.2 South Africa
- 8.6.3 UAE
- 8.6.4 Rest of Middle East & Africa
Chapter 9 Company Profiles
- 9.1 ACH Food Companies
- 9.2 ADM
- 9.3 Bunge
- 9.4 Cargill
- 9.5 Fuji Oil
- 9.6 GrainCorp
- 9.7 IOI Corporation
- 9.8 Louis Dreyfus Company
- 9.9 Nisshin Oillio
- 9.10 Wilmar

