
PUBLISHER: Global Market Insights Inc. | PRODUCT CODE: 2019173

PUBLISHER: Global Market Insights Inc. | PRODUCT CODE: 2019173
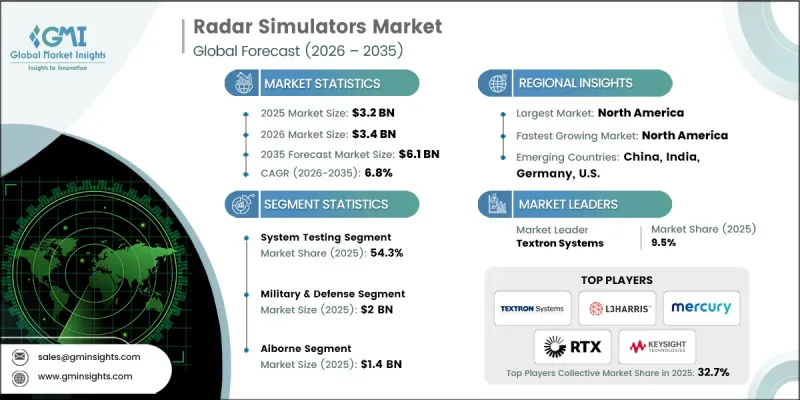
Radar Simulators Market Opportunity, Growth Drivers, Industry Trend Analysis, and Forecast 2026 - 2035
The Global Radar Simulators Market was valued at USD 3.2 billion in 2025 and is estimated to grow at a CAGR of 6.8% to reach USD 6.1 billion in 2035.
The growth is driven by increasing investments in defense modernization programs, which are fueling the adoption of radar simulators for operator, pilot, and mission training. Armed forces are increasingly leveraging simulation-based environments to reduce costs and operational risks associated with live training exercises. High-fidelity threat emulation, complex electronic warfare scenarios, and networked training solutions are accelerating adoption across air, naval, and ground defense systems worldwide. Manufacturers are incorporating artificial intelligence, machine learning, and digital twin technology to create realistic, adaptive, and scalable training platforms. Demand is also rising in air traffic management, supported by global airport modernization initiatives and the need to train controllers while validating safe radar operations. The emphasis on operational efficiency, situational awareness, and regulatory compliance is driving the adoption of advanced radar simulation tools across both defense and civilian sectors.
| Market Scope | |
|---|---|
| Start Year | 2025 |
| Forecast Year | 2026-2035 |
| Start Value | $3.2 Billion |
| Forecast Value | $6.1 Billion |
| CAGR | 6.8% |
The system testing segment accounted for 54.3% share in 2025 owing to the need for comprehensive validation of radar performance and integration with platforms. As defense programs grow in complexity, multi-sensor architectures require advanced testing solutions to meet stringent certification and operational standards globally.
The military and defense segment generated USD 2 billion in 2025. Growth in this sector is fueled by the modernization of military capabilities and demand for high-quality pilot and operator training solutions. Enhanced situational awareness, mission rehearsal, and electronic warfare preparedness continue to drive investments in simulation technologies for defense forces.
North America Radar Simulators Market captured 38.5% share in 2025. The region is witnessing strong growth due to federal and state investments in border, coastal, and airspace surveillance systems, extensive R&D by defense contractors, and the use of simulation by commercial entities to validate emerging technologies like 5G coexistence. Government procurement, public-private partnerships, and demand for advanced training facilities are accelerating the adoption of virtual radar environments across military and civilian applications.
Key players in the Global Radar Simulators Market include L3Harris Technologies, Acewavetech, Adacel Technologies Limited, ARI Simulation, Buffalo Computer Graphics, Cambridge Pixel Ltd., Keysight Technologies, Kratos Defense & Security Solutions Inc., Mercury Systems, Inc., Micro Nav Limited, Mistral Solutions, MVRsimulation Inc., Remcom Inc., RTX Corporation, SkyRadar, Textron Systems, Ultra Intelligence & Communications, Rohde & Schwarz GmbH & Co KG, and Digilogic Systems. Companies in the radar simulators market are enhancing their presence by investing in AI-driven and digital twin-based simulation technologies that deliver realistic training environments. They focus on developing modular, scalable, and networked simulation platforms for multi-domain operations, enabling rapid adaptation to evolving defense scenarios. Strategic partnerships with defense agencies, public-private collaborations, and expansion into air traffic management and civilian applications strengthen market foothold. Firms are also prioritizing system testing and validation capabilities, integrating high-fidelity threat modeling, and adopting cloud-connected solutions to provide real-time performance analytics, thereby boosting credibility, operational efficiency, and competitive positioning globally.
Table of Contents
Chapter 1 Methodology and Scope
- 1.1 Market scope and definition
- 1.2 Research design
- 1.2.1 Research approach
- 1.2.2 Data collection methods
- 1.3 Data mining sources
- 1.3.1 Global
- 1.3.2 Regional/Country
- 1.4 Base estimates and calculations
- 1.4.1 Base year calculation
- 1.4.2 Key trends for market estimation
- 1.5 Primary research and validation
- 1.5.1 Primary sources
- 1.6 Forecast model
- 1.7 Research assumptions and limitations
Chapter 2 Executive Summary
- 2.1 Industry 360° synopsis, 2022 - 2035
- 2.2 Key market trends
- 2.2.1 Material type trends
- 2.2.2 Packaging type trends
- 2.2.3 Application trends
- 2.2.4 Regional trends
- 2.3 TAM Analysis, 2026-2035
- 2.4 CXO perspectives: Strategic imperatives
Chapter 3 Industry Insights
- 3.1 Industry ecosystem analysis
- 3.1.1 Supplier Landscape
- 3.1.2 Profit Margin
- 3.1.3 Cost structure
- 3.1.4 Value addition at each stage
- 3.1.5 Factor affecting the value chain
- 3.1.6 Disruptions
- 3.2 Industry impact forces
- 3.2.1 Growth drivers
- 3.2.1.1 Increasing demand for autonomous driving technologies
- 3.2.1.2 Defense and military modernization
- 3.2.1.3 Integration of AI and machine learning
- 3.2.1.4 Rollout of 5G networks and advancements in radar-based communication technologies
- 3.2.1.5 Rising demand for Advanced Driver Assistance Systems (ADAS)
- 3.2.2 Industry pitfalls and challenges
- 3.2.2.1 High development costs
- 3.2.2.2 Complexity in simulation accuracy
- 3.2.3 Market opportunities
- 3.2.3.1 Expansion of autonomous and ADAS testing programs
- 3.2.3.2 Rising investment in next-generation defense training systems
- 3.2.1 Growth drivers
- 3.3 Growth potential analysis
- 3.4 Regulatory landscape
- 3.4.1 North America
- 3.4.2 Europe
- 3.4.3 Asia Pacific
- 3.4.4 Latin America
- 3.4.5 Middle East & Africa
- 3.5 Porter's analysis
- 3.6 PESTEL analysis
- 3.7 Technology and Innovation landscape
- 3.7.1 Current technological trends
- 3.7.2 Emerging technologies
- 3.8 Emerging business models
- 3.9 Compliance requirements
- 3.10 Defense budget analysis
- 3.11 Global defense spending trends
- 3.12 Regional defense budget allocation
- 3.12.1 North America
- 3.12.2 Europe
- 3.12.3 Asia Pacific
- 3.12.4 Middle East and Africa
- 3.12.5 Latin America
- 3.13 Key defense modernization programs
- 3.14 Budget forecast (2025-2034)
- 3.14.1 Impact on industry growth
- 3.14.2 Defense budgets by country
- 3.14.3 Defense budget allocation by segment
- 3.14.3.1 Personnel
- 3.14.3.2 Operations and maintenance
- 3.14.3.3 Procurement
- 3.14.3.4 Research, development, test and evaluation
- 3.14.3.5 Infrastructure and construction
- 3.14.3.6 Technology and innovation
- 3.15 Supply chain resilience
- 3.16 Geopolitical analysis
- 3.17 Workforce analysis
- 3.18 Digital transformation
- 3.19 Mergers, acquisitions, and strategic partnerships landscape
- 3.20 Risk assessment and management
- 3.21 Major contract awards (2022-2025)
Chapter 4 Competitive Landscape, 2025
- 4.1 Introduction
- 4.2 Company market share analysis
- 4.2.1 By region
- 4.2.1.1 North America
- 4.2.1.2 Europe
- 4.2.1.3 Asia Pacific
- 4.2.1.4 Latin America
- 4.2.1.5 Middle East & Africa
- 4.2.2 Market concentration analysis
- 4.2.1 By region
- 4.3 Competitive benchmarking of key players
- 4.3.1 Financial performance comparison
- 4.3.1.1 Revenue
- 4.3.1.2 Profit margin
- 4.3.1.3 R&D
- 4.3.2 Product portfolio comparison
- 4.3.2.1 Product range breadth
- 4.3.2.2 Technology
- 4.3.2.3 Innovation
- 4.3.3 Geographic presence comparison
- 4.3.3.1 Global footprint analysis
- 4.3.3.2 Service network coverage
- 4.3.3.3 Market penetration by region
- 4.3.4 Competitive positioning matrix
- 4.3.4.1 Leaders
- 4.3.4.2 Challengers
- 4.3.4.3 Followers
- 4.3.4.4 Niche players
- 4.3.5 Strategic outlook matrix
- 4.3.1 Financial performance comparison
- 4.4 Key developments
- 4.4.1 Mergers and acquisitions
- 4.4.2 Partnerships and collaborations
- 4.4.3 Technological advancements
- 4.4.4 Expansion and investment strategies
- 4.4.5 Digital transformation initiatives
- 4.5 Emerging/ startup competitors landscape
Chapter 5 Market Estimates and Forecast, By Component, 2022 - 2035 (USD Million)
- 5.1 Key trends
- 5.2 Hardware
- 5.2.1 Signal generators
- 5.2.2 RF emulators & target simulators
- 5.2.3 Others
- 5.3 Software
- 5.3.1 Modeling & physics simulation suites
- 5.3.2 Scenario generation & mission planning software
- 5.3.3 Others
Chapter 6 Market Estimates and Forecast, By Functionality, 2022 - 2035 (USD Million)
- 6.1 Key trends
- 6.2 System testing
- 6.3 Operator training
Chapter 7 Market Estimates and Forecast, By Platform, 2022 - 2035 (USD Million)
- 7.1 Key trends
- 7.2 Airborne
- 7.3 Ground
- 7.4 Marine
Chapter 8 Market Estimates and Forecast, By Platform, 2022 - 2035 (USD Million)
- 8.1 Key trends
- 8.2 Military & defense
- 8.3 Commercial
- 8.3.1 Aviation
- 8.3.2 Automobiles
- 8.3.3 Meteorology & environment
- 8.3.4 Others
Chapter 9 Market Estimates and Forecast, By Region, 2022 - 2035 (USD Million)
- 9.1 Key trends
- 9.2 North America
- 9.2.1 U.S.
- 9.2.2 Canada
- 9.3 Europe
- 9.3.1 Germany
- 9.3.2 UK
- 9.3.3 France
- 9.3.4 Spain
- 9.3.5 Italy
- 9.3.6 Russia
- 9.3.7 Netherlands
- 9.3.8 Rest of Europe
- 9.4 Asia Pacific
- 9.4.1 China
- 9.4.2 India
- 9.4.3 Japan
- 9.4.4 Australia
- 9.4.5 South Korea
- 9.4.6 Rest of Asia-Pacific
- 9.5 Latin America
- 9.5.1 Brazil
- 9.5.2 Mexico
- 9.5.3 Argentina
- 9.5.4 Rest of Latin America
- 9.6 Middle East and Africa
- 9.6.1 South Africa
- 9.6.2 Saudi Arabia
- 9.6.3 UAE
- 9.6.4 Rest of Middle East and Africa
Chapter 10 Company Profiles
- 10.1 Global Key Players
- 10.1.1 Keysight Technologies
- 10.1.2 L3Harris Technologies, Inc.
- 10.1.3 Mercury Systems, Inc.
- 10.1.4 RTX Corporation
- 10.1.5 Textron Systems
- 10.1.6 Rohde & Schwarz GmbH & Co KG
- 10.1.7 Kratos Defense & Security Solutions Inc.
- 10.1.8 Ultra Intelligence & Communications
- 10.2 Regional key players
- 10.2.1 North America
- 10.2.1.1 Buffalo Computer Graphics
- 10.2.2 Asia-Pacific
- 10.2.2.1 Micro Nav Limited
- 10.2.2.2 Adacel Technologies Limited
- 10.2.3 Europe
- 10.2.3.1 Cambridge Pixel Ltd.
- 10.2.3.2 SkyRadar
- 10.2.1 North America
- 10.3 Niche Players/Disruptors
- 10.3.1 Acewavetech
- 10.3.2 ARI Simulation
- 10.3.3 Mistral Solutions
- 10.3.4 MVRsimulation Inc.
- 10.3.5 Remcom Inc.
- 10.3.6 Digilogic Systems

